USD/ZAR Price Analysis: Keeps recovery moves from 50% Fibonacci retracement
- USD/ZAR prints mild gains while carrying the pullback from 16.87.
- 200-bar SMA, seven-day-old resistance line challenge the buyers.
- 61.8% Fibonacci retracement adds to the downside support.
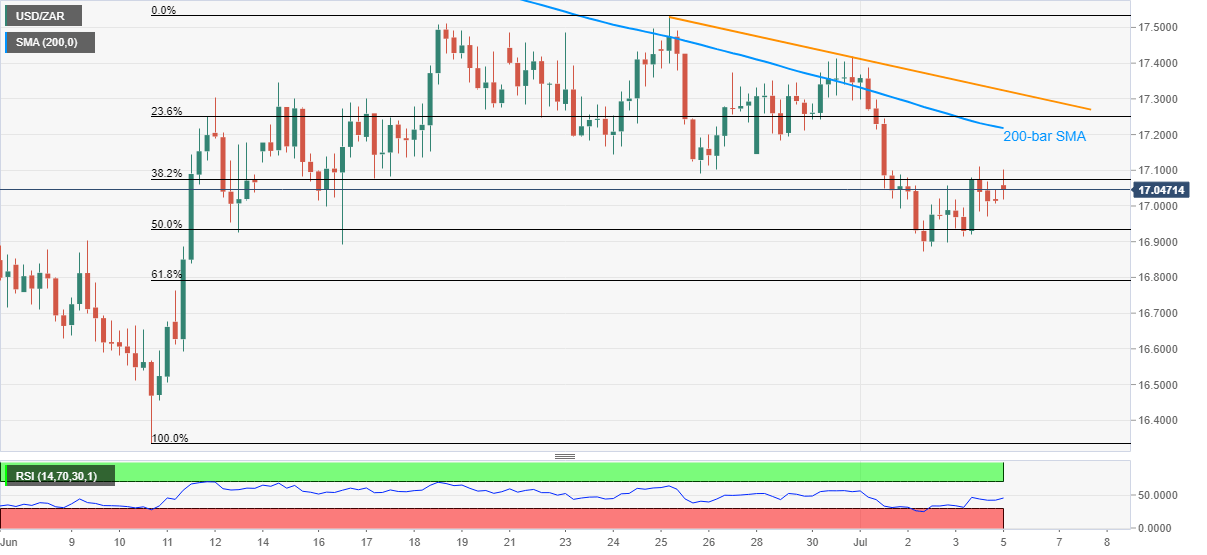
USD/ZAR seesaws around 17.08 while flashing 0.40% gains on the day amid the early Monday morning in Asia. In doing so, the pair carries its recovery moves from 50% Fibonacci retracement of June 10-25 upside.
As a result, buyers are again targeting a break of 200-bar SMA, currently around 17.22, after multiple failures during late-June. Also acting as an immediate upside barrier is a falling trend line from June 25, at 17.32 now.
Considering the normal RSI conditions, coupled with the pair’s sustained trading beyond the key Fibonacci support, buyers might not hesitate to attack the 18.00 threshold on the successful break above June 25 top near 17.50/55.
Alternatively, a 61.8% Fibonacci retracement level of 16.79 may offer extra support below 16.93 immediate rest-point.
Given the pair’s additional weakness past-16.79, 16.50/45 might offer an intermediate halt before dragging the quote to 16.00 round-figure.
USD/ZAR four-hour chart
Trend: Further recovery expected