EUR/USD Price Analysis: Pullback stalls at key SMA support
- EUR/USD's downside is being capped by a 4-hour chart SMA.
- A move above 1.1353 is needed to neutralize the immediate bearish bias.
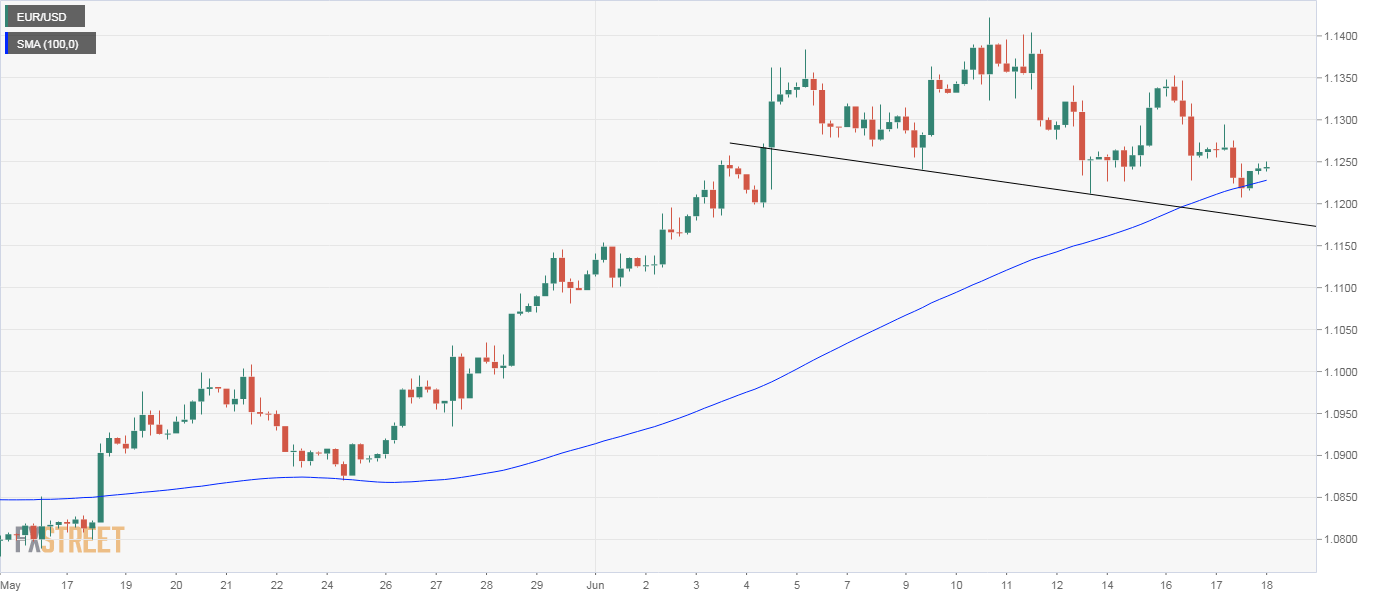
EUR/USD's pullback from recent highs above 1.14 looks to have stalled near the 4-hour chart 100-candle simple moving average (SMA).
The pair is currently trading near 1.1245, having put in a low at the key SMA support at 1.1212 during the American trading hours. The minor bounce does not change the immediate bearish bias, suggested by the below-50 reading on the relative strength index.
Moreover, a move above 1.1353 is needed to invalidate the lower high setup on the 4-hour chart and revive the bullish setup.
Also, the pair seems to have created a head-and-shoulders pattern on the 4-hour chart. The neckline support is currently located at 1.1187, which, if breached, could yield a stronger chart-driven selling, leading to a drop below 1.11. Supporting the case for a decline below 1.1187 is the bearish crossover of the 50- and 200-hour SMAs and the bearish reading on the hourly chart RSI.
4-hour chart
Trend: Bearish
Technical levels