20 May 2020
Silver Price Analysis: 11-week-old horizontal resistance guards immediate upside
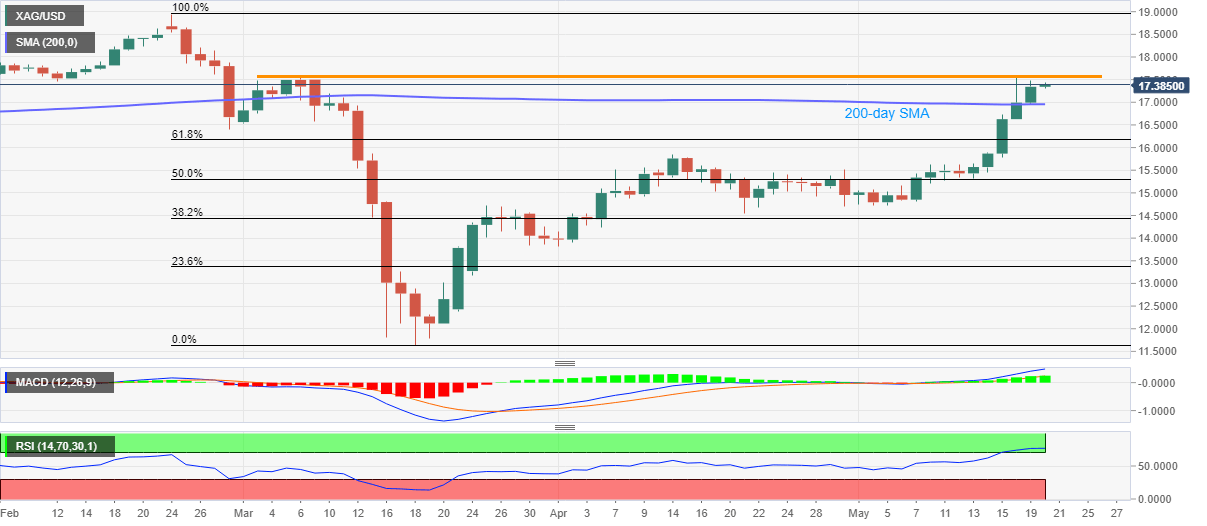
- Silver prices register six-day winning streak, trades comfortably above 200-day SMA.
- Highs marked in March, as well as on Monday, check the bulls amid overbought RSI.
While staying firmly beyond 200-day SMA, Silver prints a six-day winning streak as taking the bids bear $17.37 during early Wednesday.
Even so, white metal remains below the horizontal line comprising highs marked during March month and also on Monday around $17.57/58.
As a result, overbought RSI conditions may trigger the bullion’s pullback to a 200-day SMA level of $16.96.
Though, the metal’s further downside might stall around 61.8% Fibonacci retracement of February-March drop, near $16.17.
Alternatively, a clear break of $17.58 enables the bulls to challenge February month top of $18.95 while likely taking intermediate stops around $18.00 and $18.25 during the rise.
Silver daily chart
Trend: Pullback expected