24 Apr 2020
USD/JPY Price Analysis: Mildly bid below 108 after Thursday’s spinning top
- USD/JPY extends recovery gains from Tokyo after marking sellers’ exhaustion the previous day.
- A confluence of 21-day SMA, 61.8% Fibonacci retracement restricts the immediate recoveries.
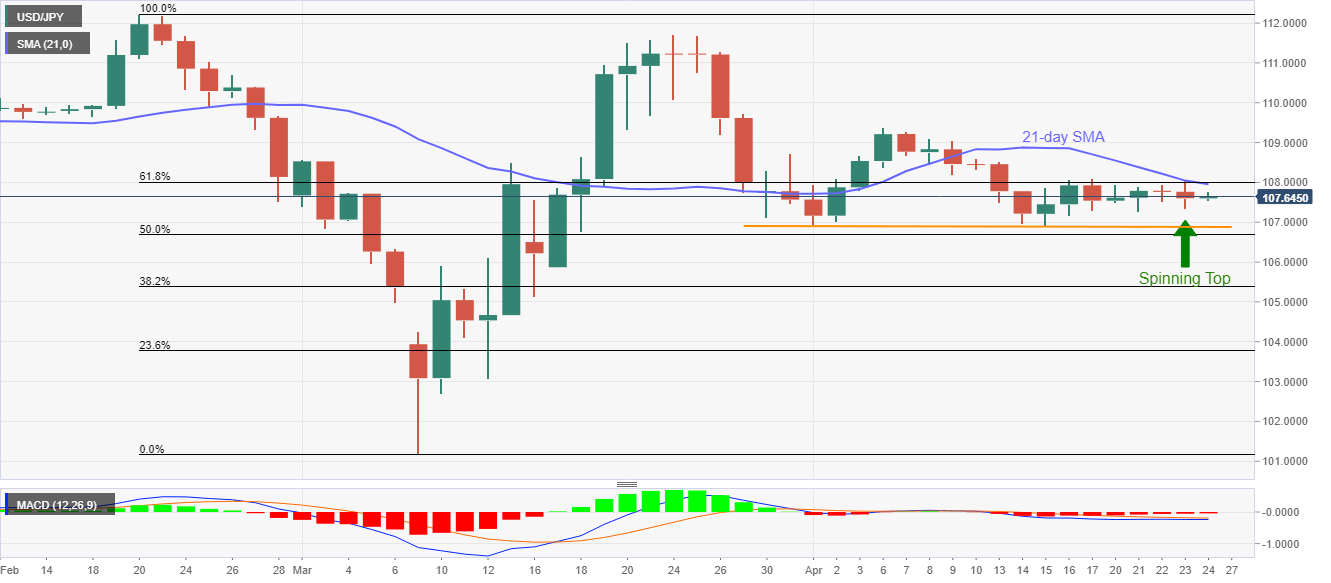
USD/JPY justifies the previous day’s candlestick formation while taking rounds to 107.65 ahead of the European session on Friday.
While a spinning top suggested bears’ exhaustion on Thursday, a confluence of 21-day SMA, and 61.8% Fibonacci retracement of the pair’s February-March fall, near 107.95/108.00 restricts the recoveries.
Also likely to challenge the pair’s upside past-108.00 will be the monthly top surrounding 109.40, a break of which could recall buyers targeting 110+ figures.
On the contrary, a horizontal line connecting the monthly lows, near 106.90 restricts the pair’s immediate declines.
Should there be a further downside below 106.90, 106.00 and 105.90 are likely to keep the bears entertained.
USD/JPY daily chart
Trend: Sideways