23 Apr 2020
Oil New York Price Forecast: WTI recovers from selloff, trades near $16.20 per barrel
- After its historic dive WTI is recovery slightly.
- The level to beat for bears is the 13.16 support.
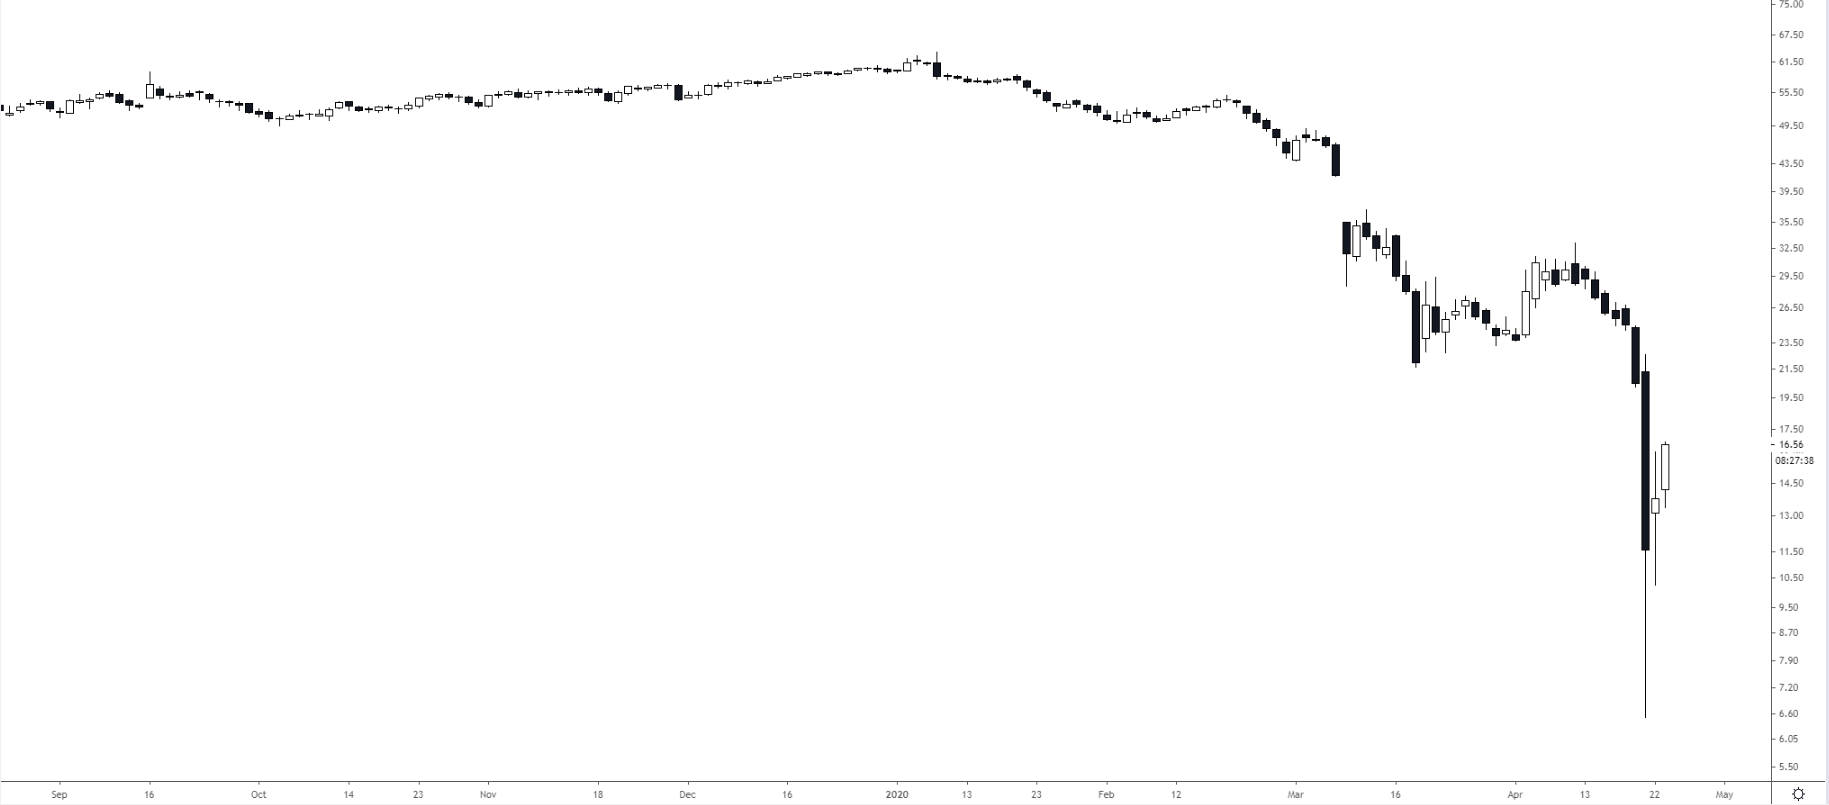
WTI daily chart
WTI took a historic dive this week as the market is now consolidating the recent losses.
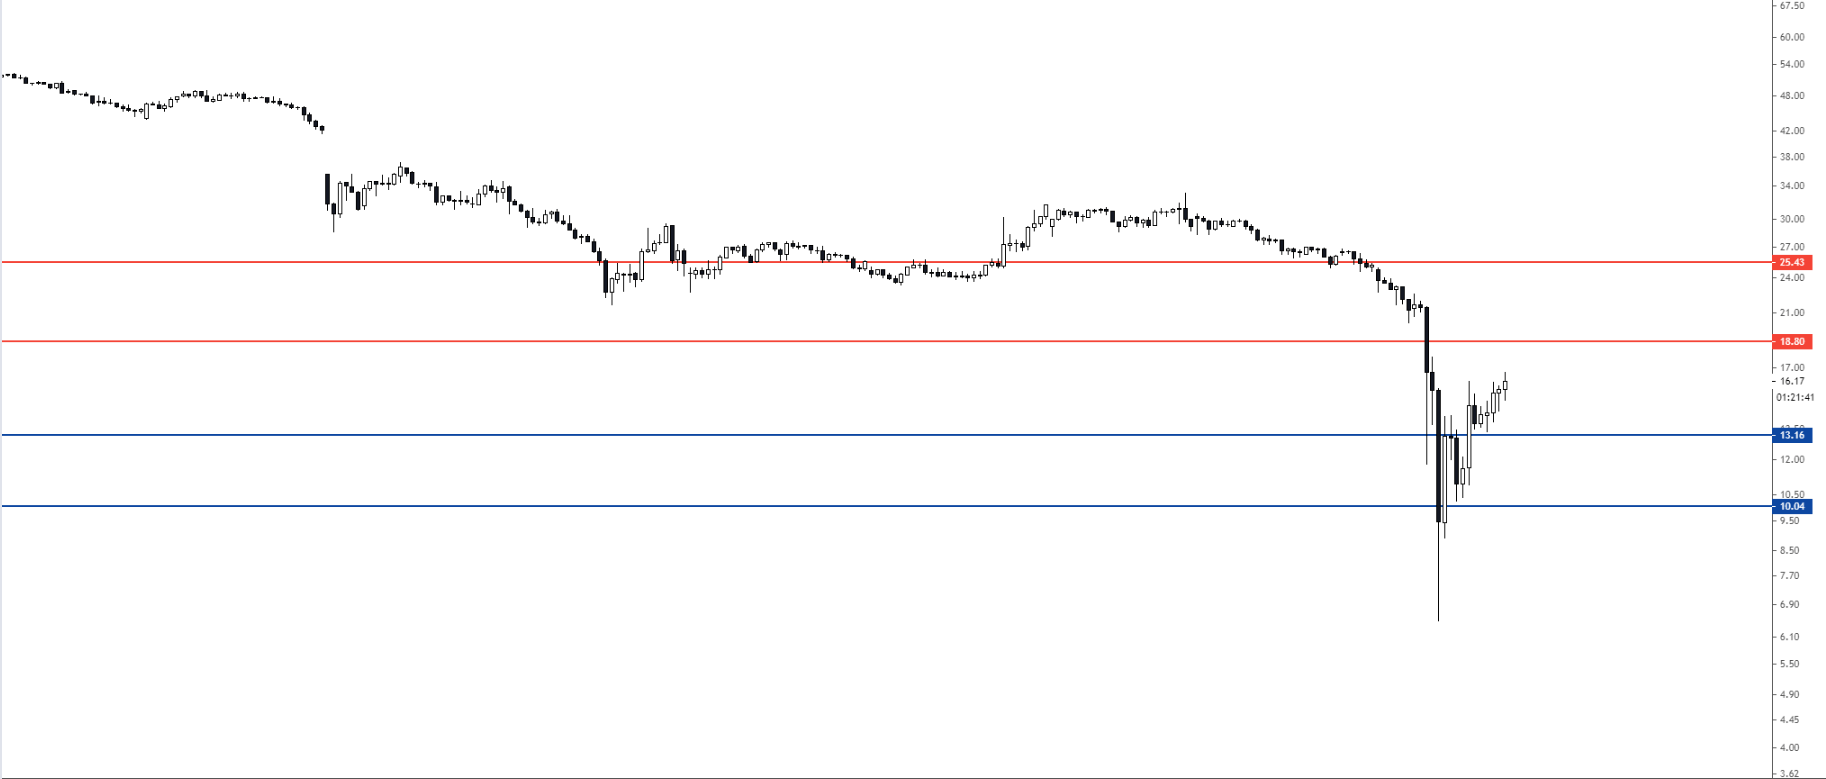
WTI four-hour chart
WTI is climbing back up after its sharp drop. It is unclear if the recovery can go very far as the overall bias remains negative on oil. The level to beat for bears is the 13.16 support followed by 10.04. On the flip side, the market can find resistance near 18.80 and 25.43 levels on the way up.
Additional key levels