20 Apr 2020
WTI Price Analysis: Mildly bid above $18.00 inside weekly falling channel
- WTI remains under pressure, despite the positive start, inside the bearish technical pattern.
- 200-HMA adds to the upside barrier, the year 2001 low on the bears’ radar.
While a gap-up opening keeps WTI on the positive side, up 0.90% on a day, as taking rounds to $18.30, the energy benchmark has recently witnessed downside pressure amid the early Asian session on Monday.
As a result, sellers are again watching over Friday’s low near $17.30 to return to the charts ahead of the year 2001 bottoms surrounding $16.70.
Should there be further downside past-$16.70, the one-week-old channel’s support line near $16.00 could offer breathing space to the bears.
Alternatively, the aforementioned channel’s resistance-line, near $19.10, caps the immediate upside ahead of 200-HMA figures of $22.85.
Though, a sustained break above $22.85 enables the bulls to question the monthly top surrounding $28.90.
WTI hourly chart
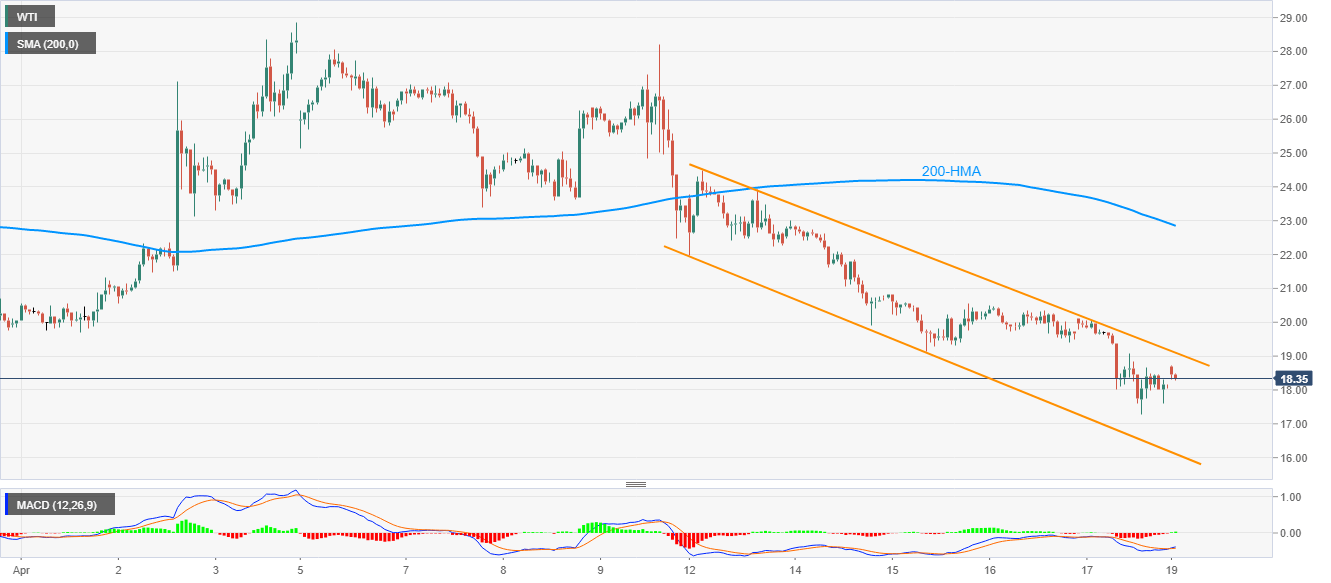
Trend: Bearish