WTI Price Analysis: 10-day SMA guards immediate upside
- WTI trims early-day gains, nears seven-day low.
- Buyers will look for entry beyond 23.6% Fibonacci retracement.
- Sellers can aim for three-week-old horizontal support for fresh declines.
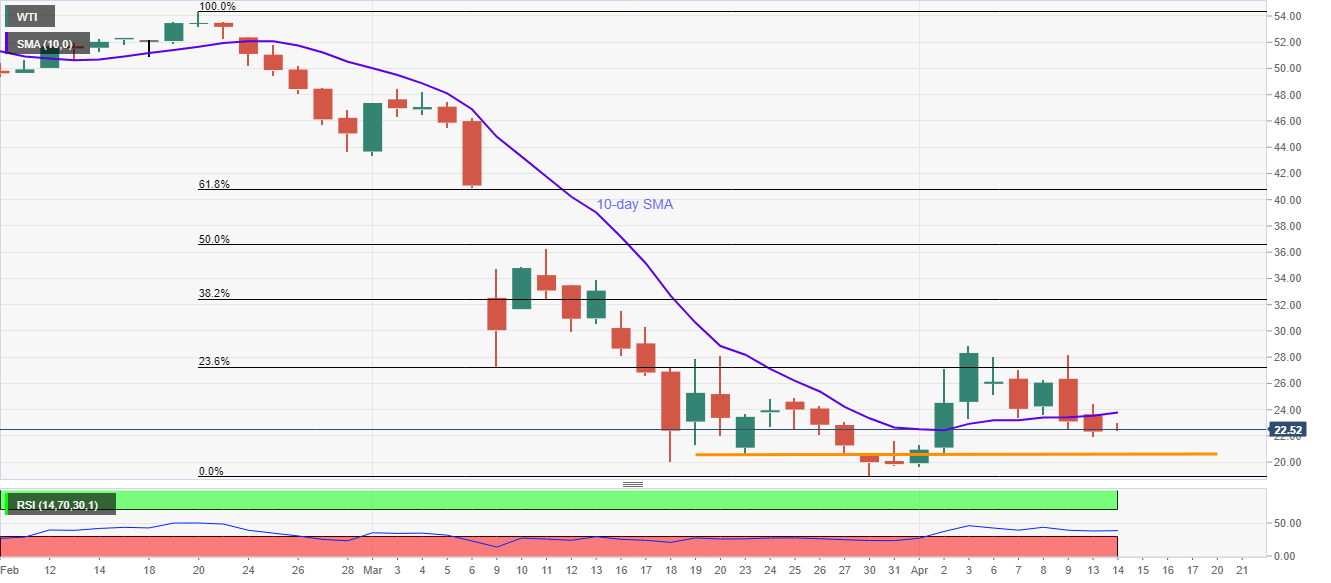
While portraying gradual pullback moves from the intraday high, WTI trades near $22.55, up 0.90% on a day, during early Tuesday. In doing so, the oil benchmark trims most of the Asian session gains and stay below 10-day SMA.
As a result, the black gold seems to be under pressure to retest the multi-day old horizontal support, around $20.60, ahead of revisiting the sub-$20.00 area.
On the contrary, the oil price rally beyond the 10-day SMA level of $23.80 can’t be considered as a strong upside signal as 23.6% Fibonacci retracement level of its February-March downside, around $27.25, remains as the strong resistance.
If at all the buyers manage to cross $27.25 on a daily closing basis, the monthly top surrounding $28.90, as well as $30.00, could be on their radars.
WTI daily chart
Trend: Bearish