12 Dec 2019
AUD/USD Price Analysis: Aussie clings to weekly gains near 0.6900 handle
- AUD/USD is continuing to grind up following the massive breakout seen on Wednesday.
- Resistances on the way up can be located near 0.6912 and 0.6931 levels.
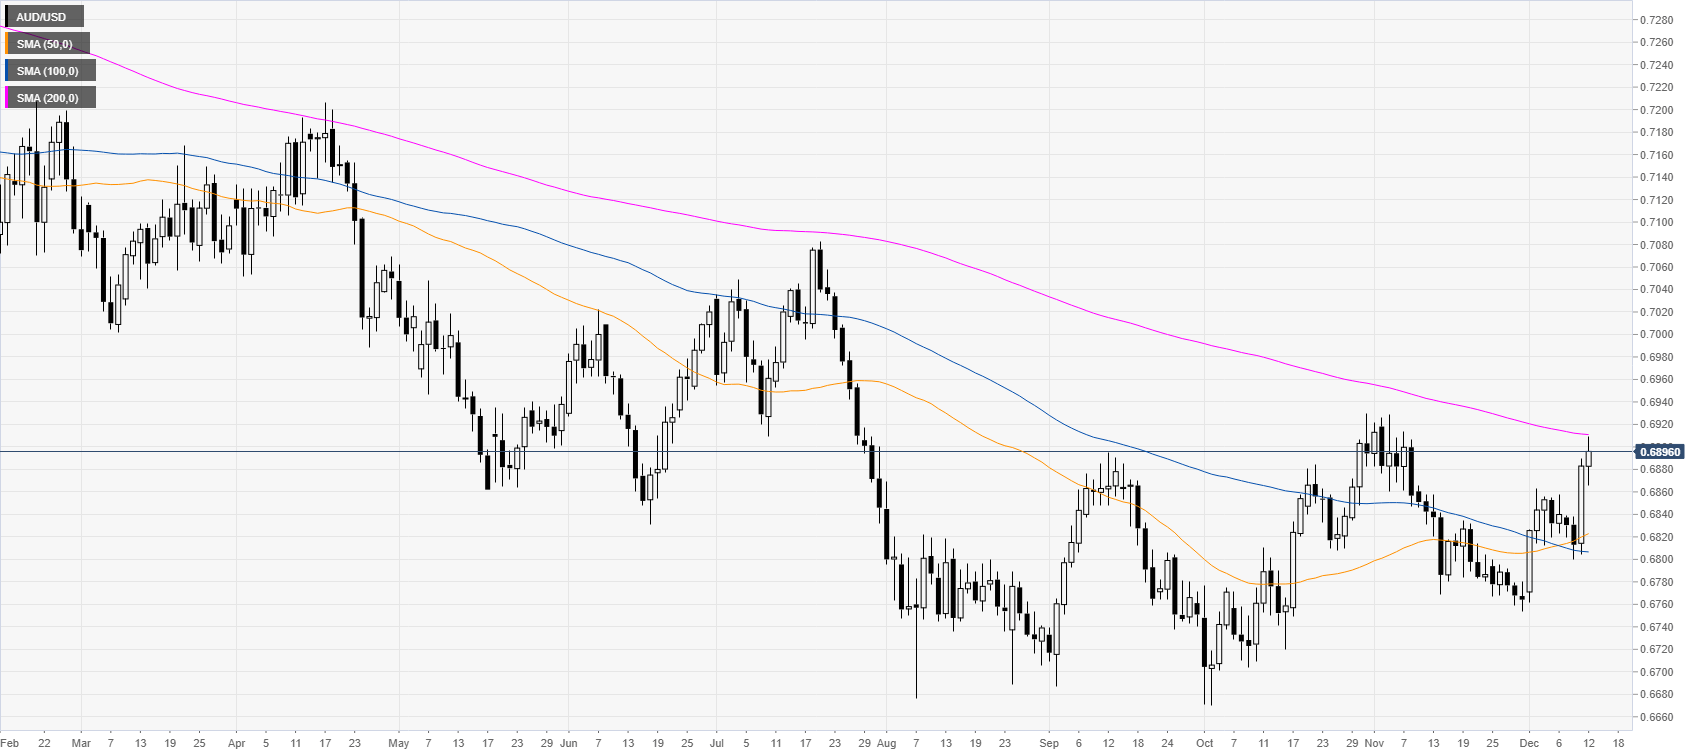
AUD/USD daily chart
AUD/USD is trading just below the 0.6900 handle and the 200-day simple moving average (DMA) as the market is trading at fresh December highs this Thursday.
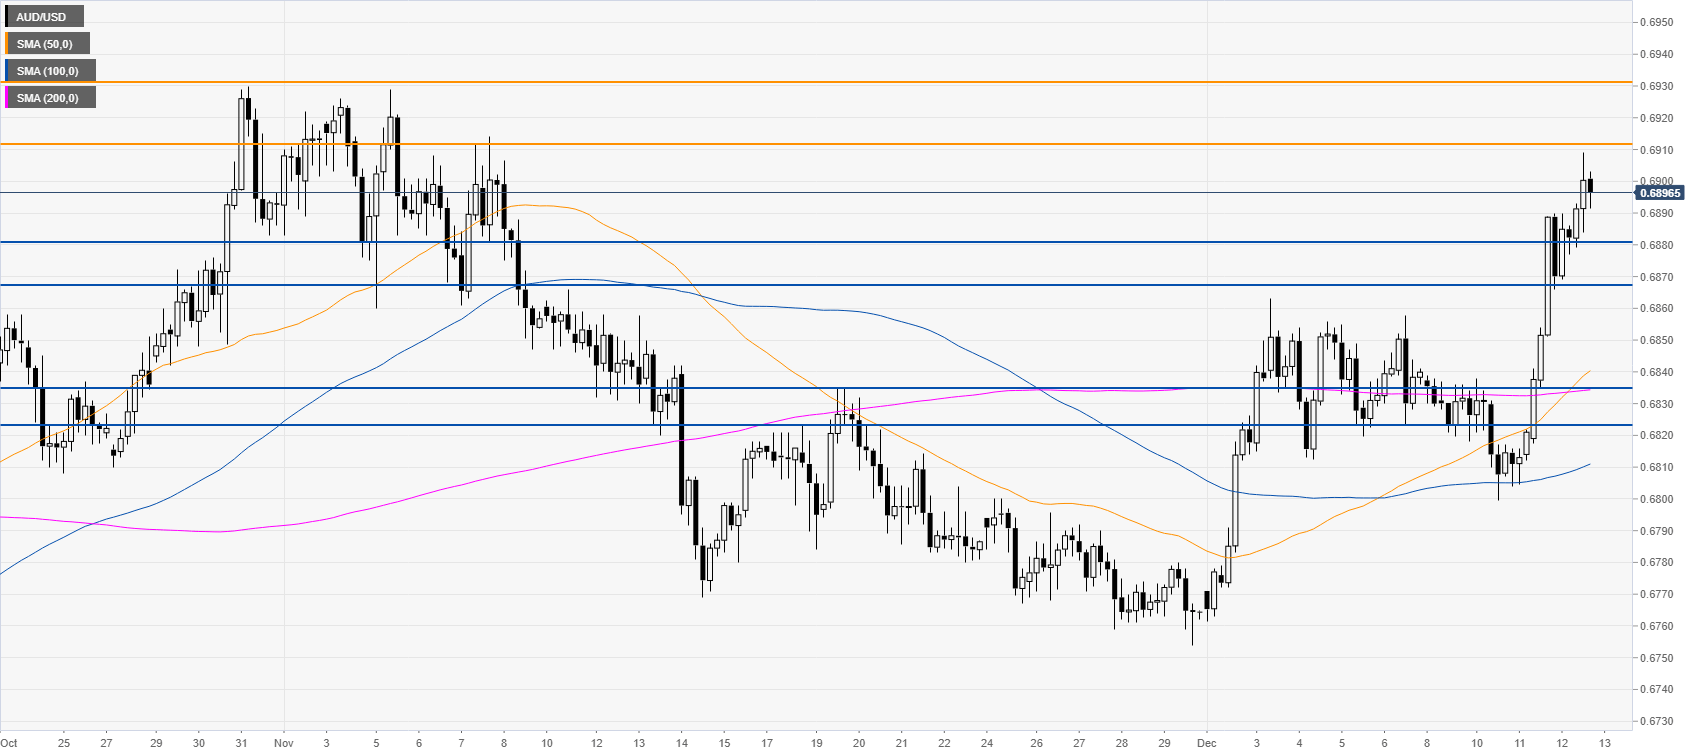
AUD/USD four-hour chart
AUD/USD is creeping higher after the strong boost seen on Wednesday. As the buyers remain in control, the spot will probably try to reach the 0.6912 and 0.6931 resistance levels, according to the Technical Confluences Indicator.
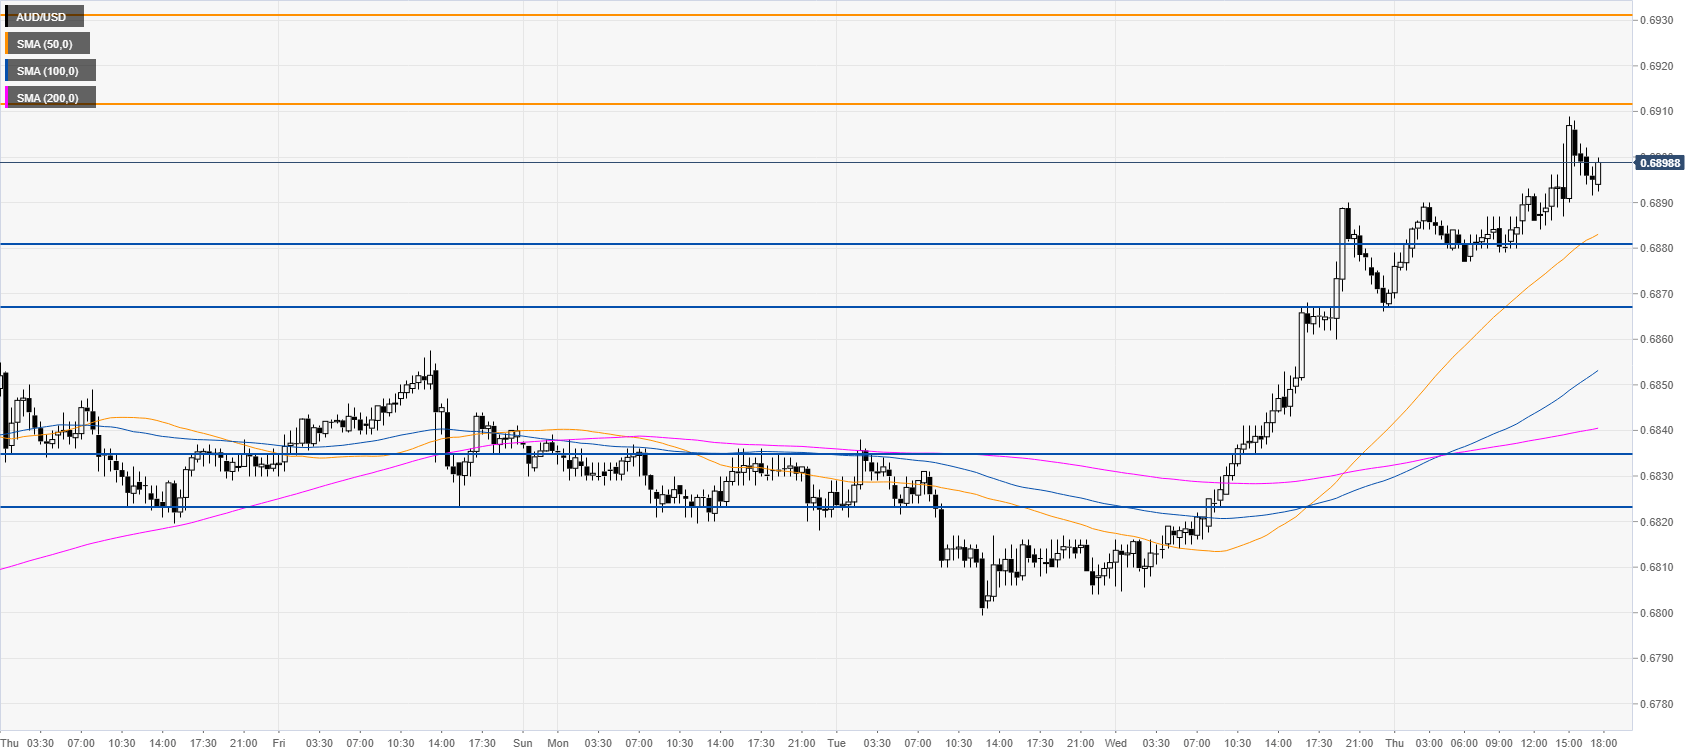
AUD/USD 30-minute chart
The market remains one-sided while trading above the main SMAs. Support is seen at the 0.6880/0.6867 price zone. A break below it could lead to deeper pullback towards the 0.6838/0.6824 price zone, according to the Technical Confluences Indicator.
Additional key levels