12 Dec 2019
Gold Price Analysis: XAU/USD trading at one-month highs, challenging $1485/oz
- Gold is testing the 1485 resistance near the 100-day SMA.
- The level to beat for buyers is the 1492 resistance.
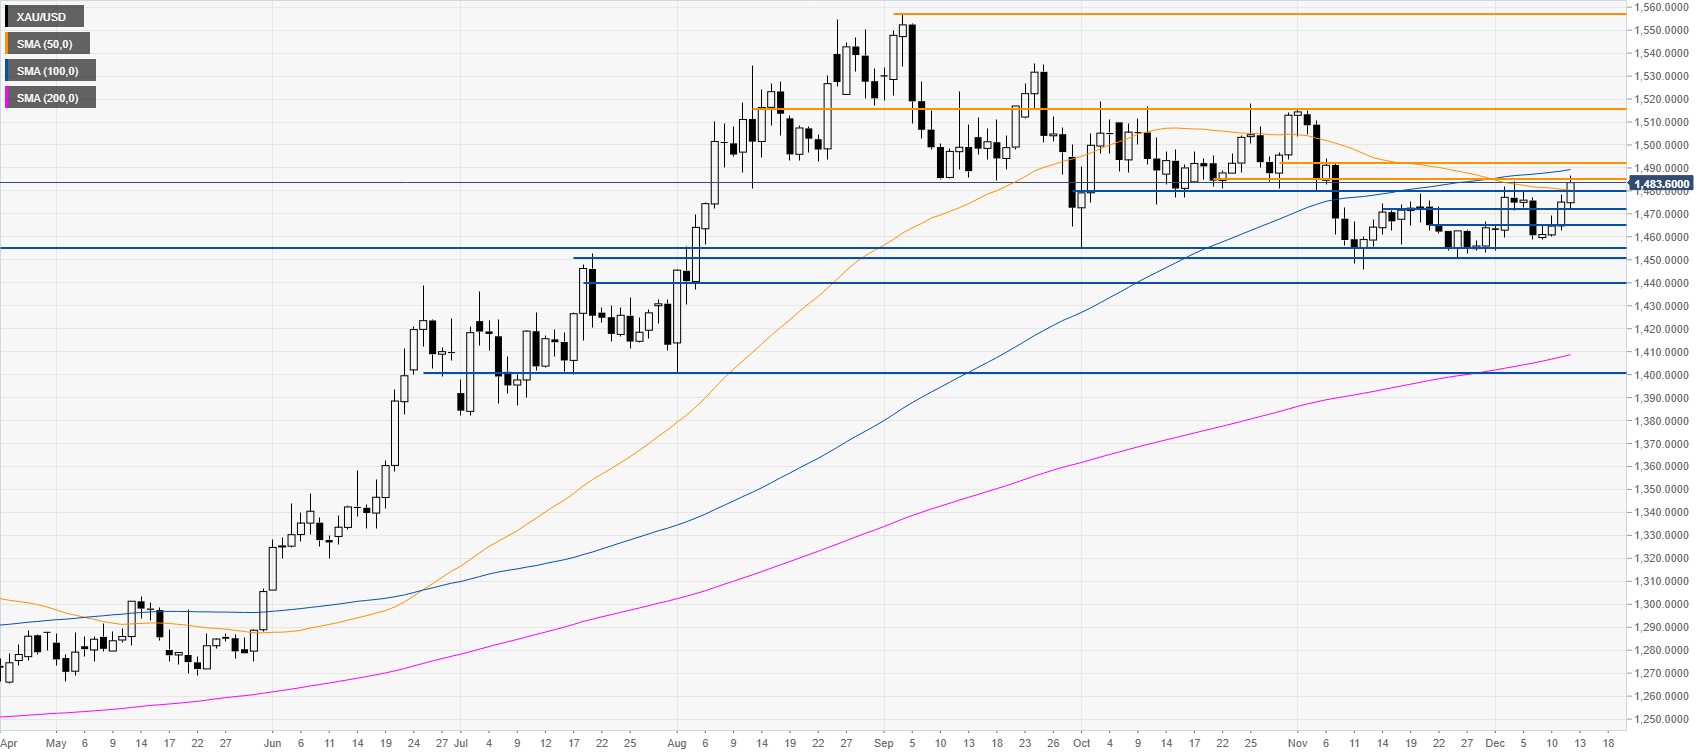
Gold daily chart
Gold is trading near its highest point in a month while nearing the 100-day SMA. Since September gold has been consolidating the previous gains made in early 2019.
Gold four-hour chart
XAU/USD is challenging the 1485 resistance level while above its main SMAs on the four-hour chart. A daily close above 1485 can lead to further gains towards the 1492 and 1515 resistances. Support is seen at the 1479 and 1472 price levels.
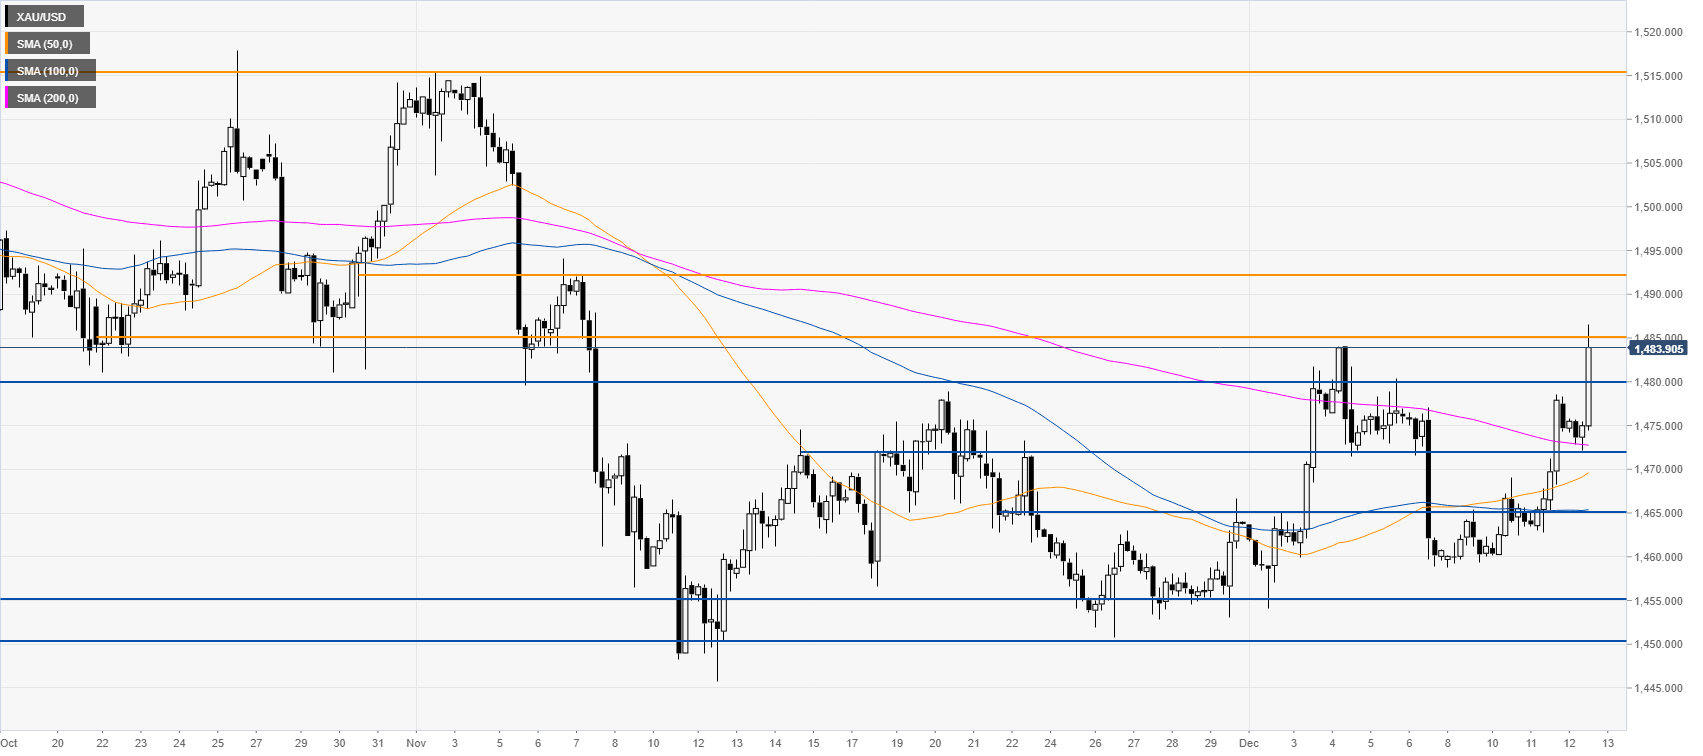
Additional key levels