12 Dec 2019
GBP/USD Price Analysis: Pound tumbles to session’s lows near 1.3120 level
- GBP/USD is trading near session’s lows approaching the 1.3120 support level.
- Resistance is seen at the 1.3155 price level.
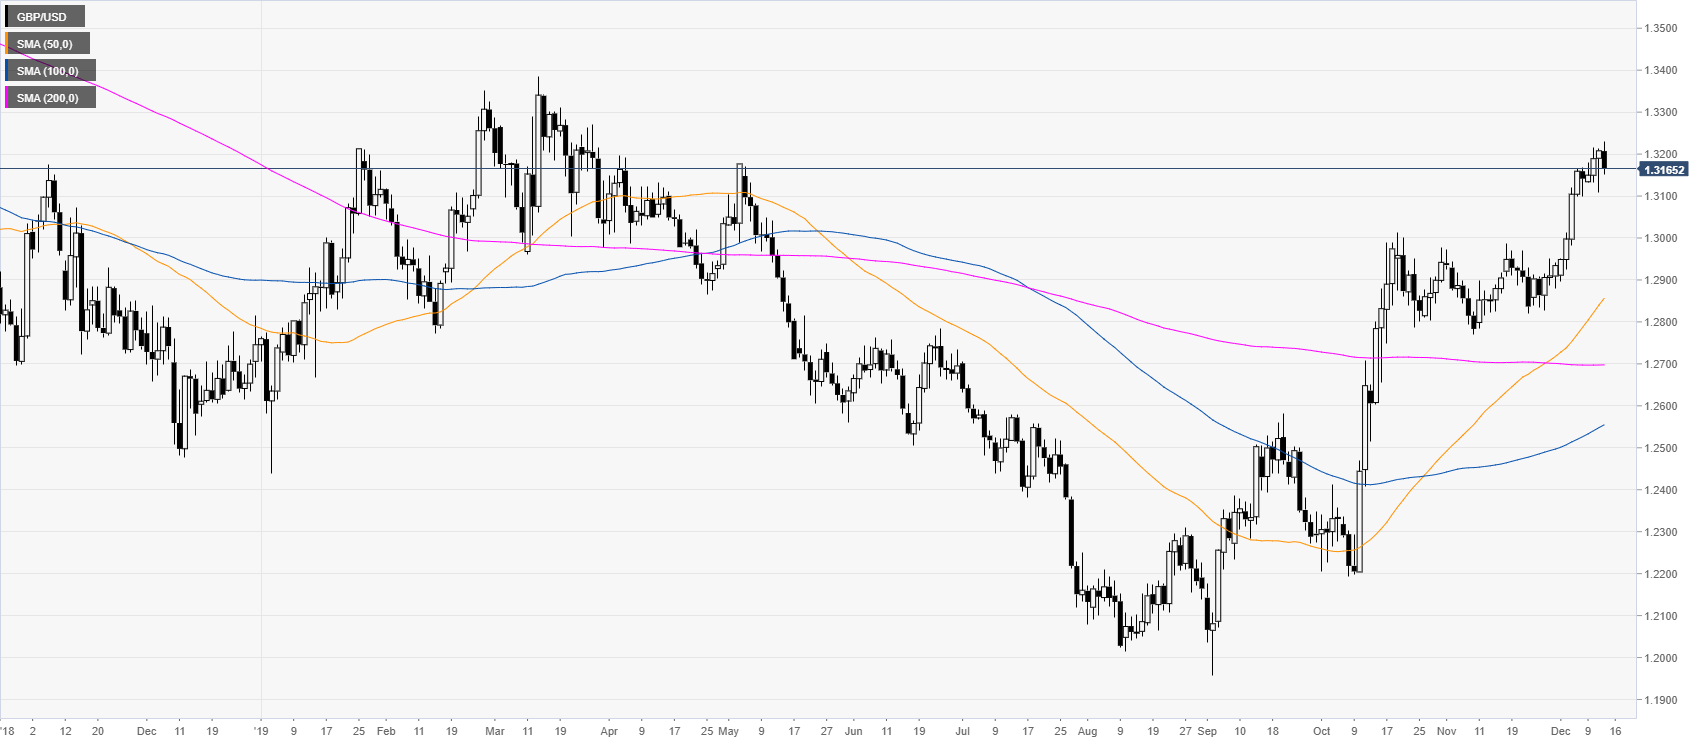
GBP/USD daily chart
The spot is easing from eight-month highs trading just below the 1.3200 handle. The underlying tone remains bullish while above the main daily SMAs.
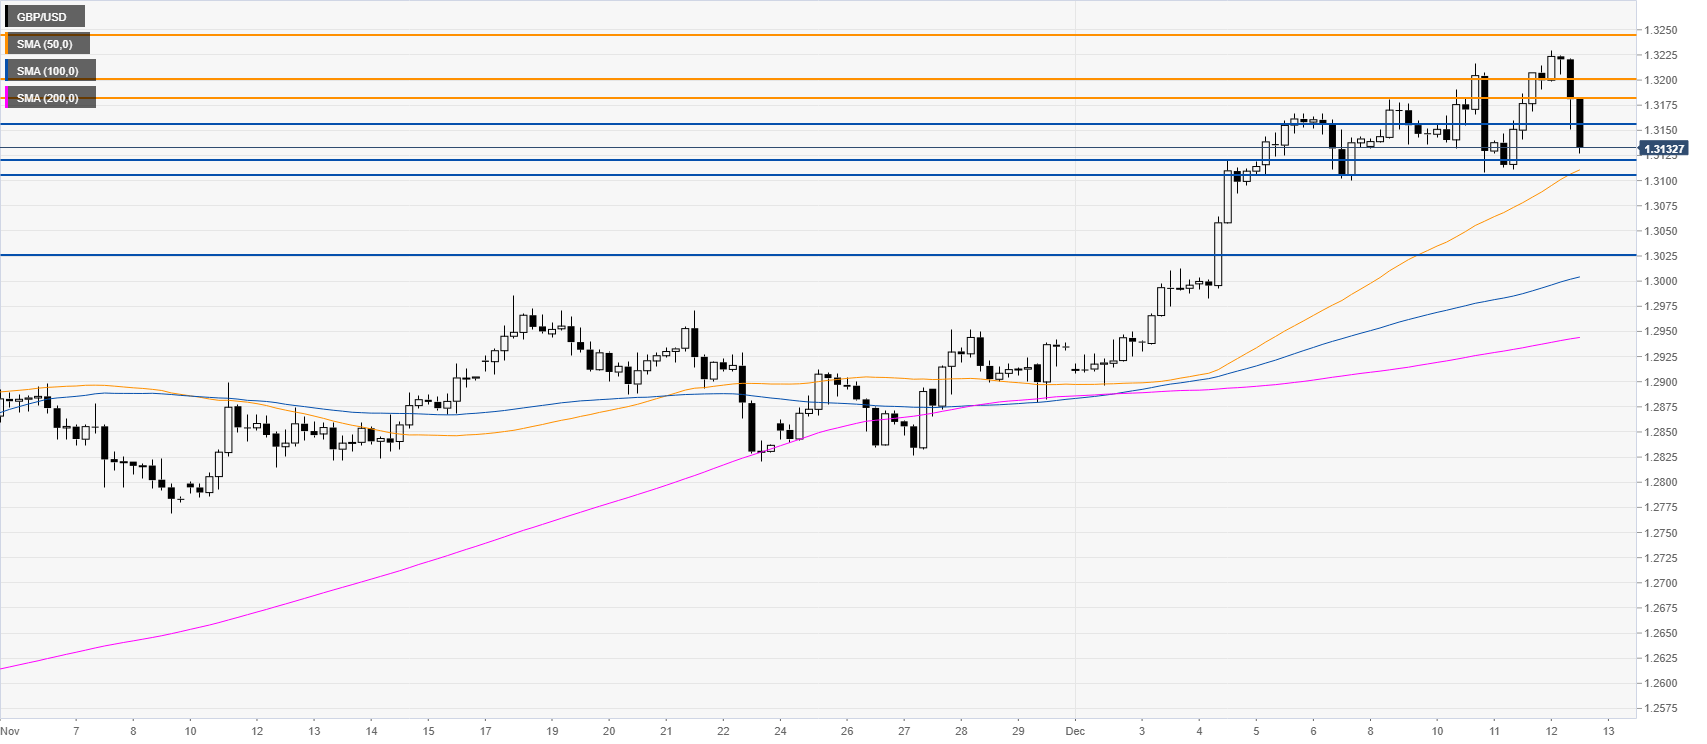
GBP/USD four-hour chart
GBP/USD is trading above the main SMAs, suggesting a bullish momentum in the medium term. However, sellers are breaking below the 1.3155 support level. As the market is declining it could reach the 1.3121/07 support zone. If this level is broken, it might lead to a deeper pullback down towards the 1.3025 level, according to the Technical Confluences Indicator.
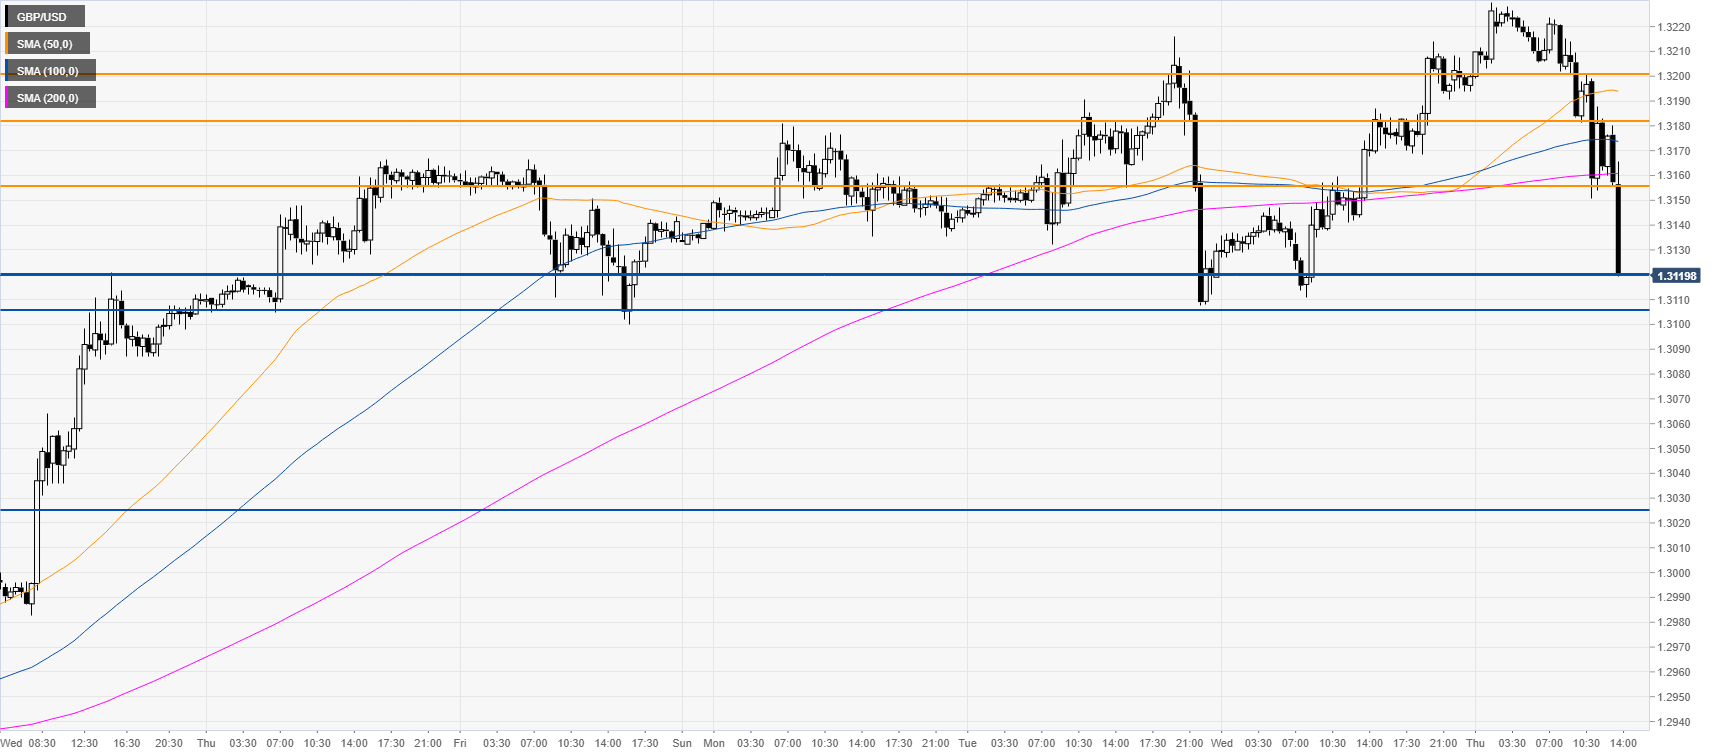
GBP/USD 30-minute chart
The spot is trading below the main SMAs, suggesting a bearish bias in the short term. Resistance is seen at the 1.3155 level near the main SMAs and at the 1.3180 and 1.3200 handle.
Additional key levels