USD/IDR Technical Analysis: Confronts key support-turned-resistance
- USD/IDR recently bounced off the three-month-old rising support line.
- 21-day EMA adds to the upside barrier.
- Lows marked in November and September gain sellers’ attention on the break of the support trend line.
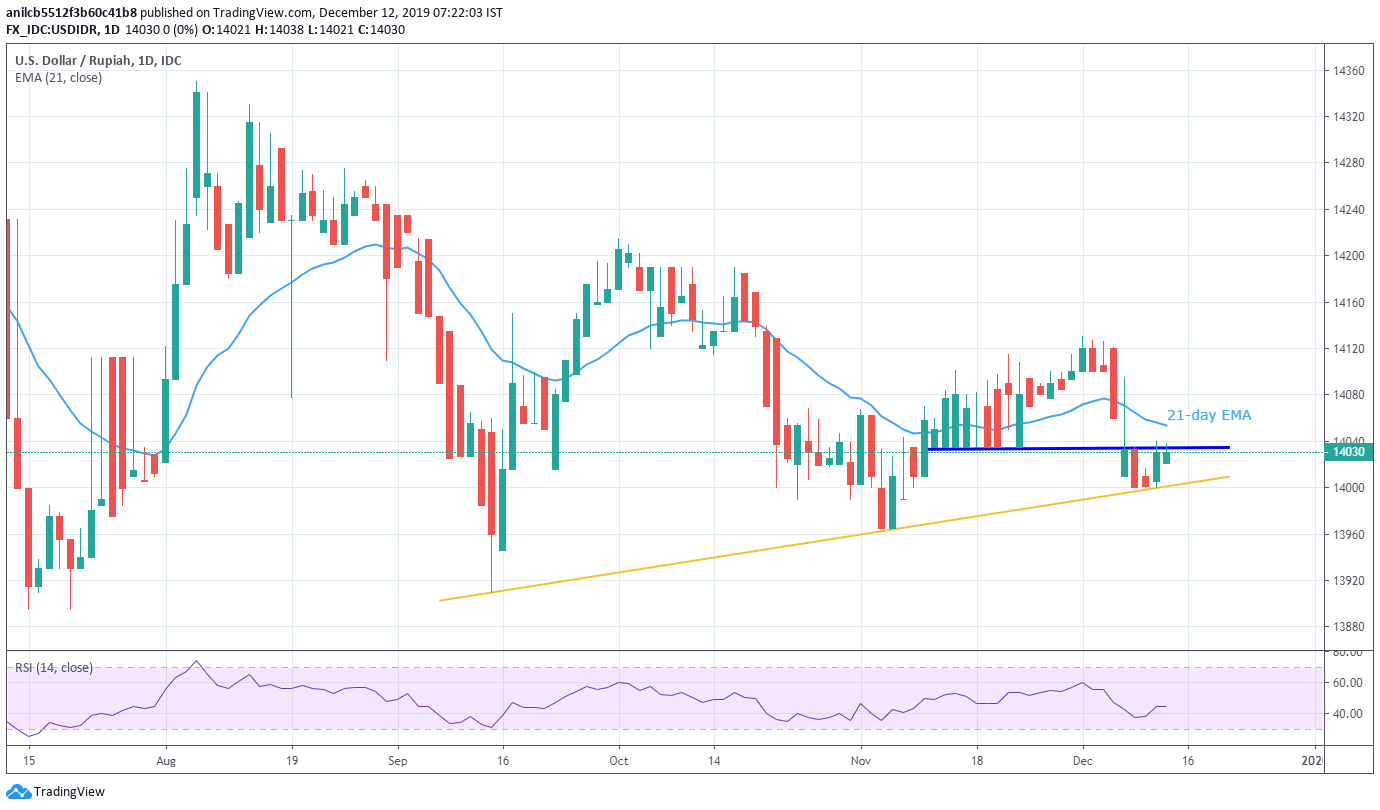
Following its pullback from the three-month-old rising trend line, USD/IDR extends recovery to 14,030 during early Thursday’s trading session. Even so, the pair confronts a month-long horizontal resistance, previous support.
Should buyers manage to cross 14,035 on a daily closing basis, 21-day Exponential Moving Average (EMA) around 14,055 will challenge the pair’s further recovery.
Though, an upside clearance of 14,055 will escalate the buying towards the monthly top surrounding 14,130.
Meanwhile, pair’s declines below near-term key support, at 14,000 now, can recall November month low of 13,965 to the charts.
Additionally, bears can target lows marked in July and September months, near 13,880, during the pair’s declines past-13,965.
USD/IDR daily chart
Trend: Pullback expected