10 Dec 2019
USD/JPY price analysis: Greenback clings to daily gains against yen near 108.70 level
- USD/JPY is trading off the December lows, but below its 200 DMA.
- Support is seen at the 108.64 and 108.47/36 price levels.
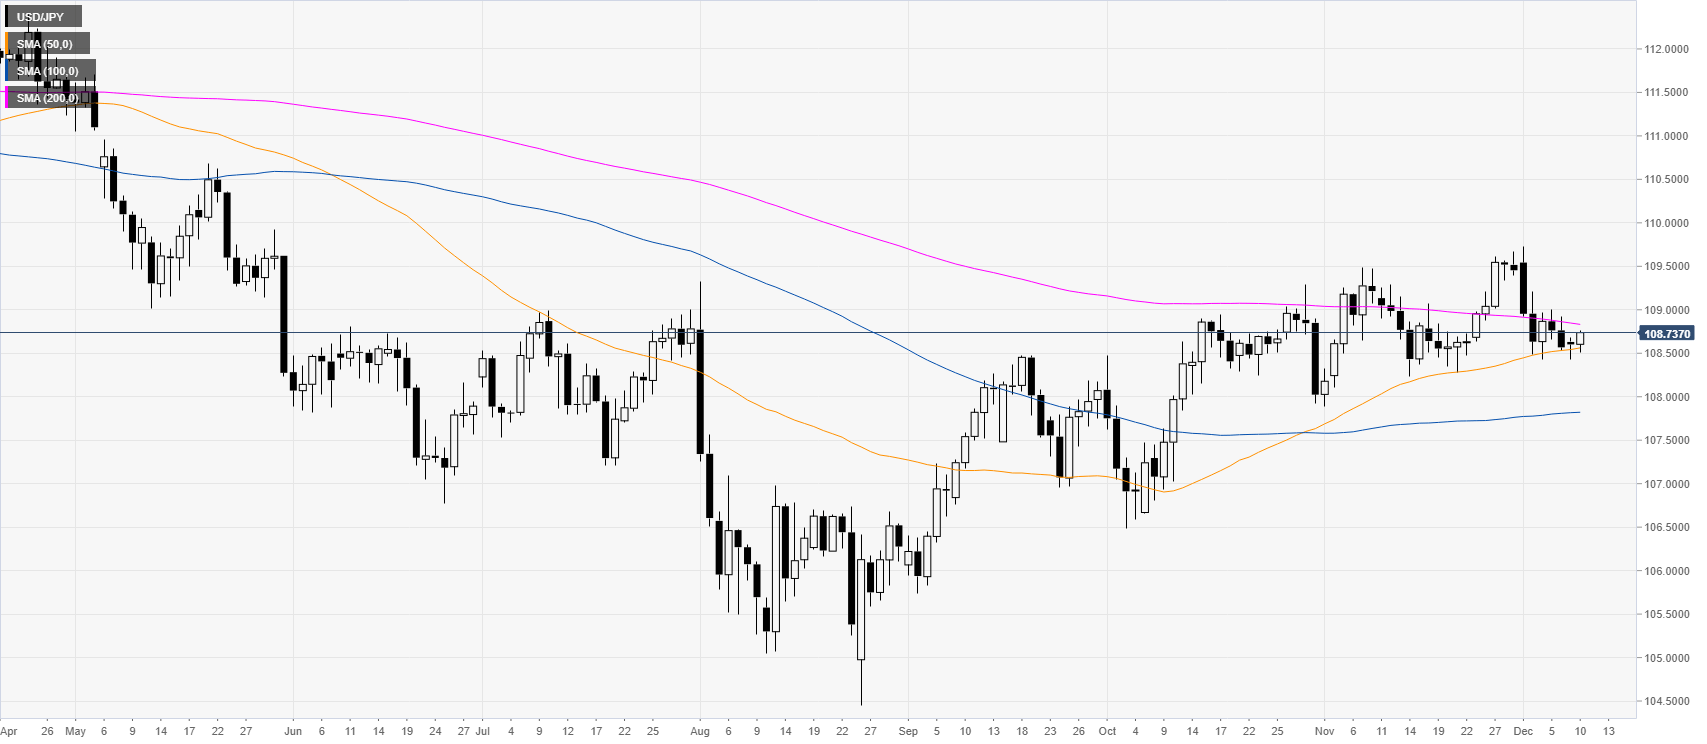
USD/JPY daily chart
USD/JPY is trading off the December lows above the 108.50 level and the 50-day simple moving average (DMA). However, the exchange rate is still trading below the 200 DMA, which weakens the bull case.
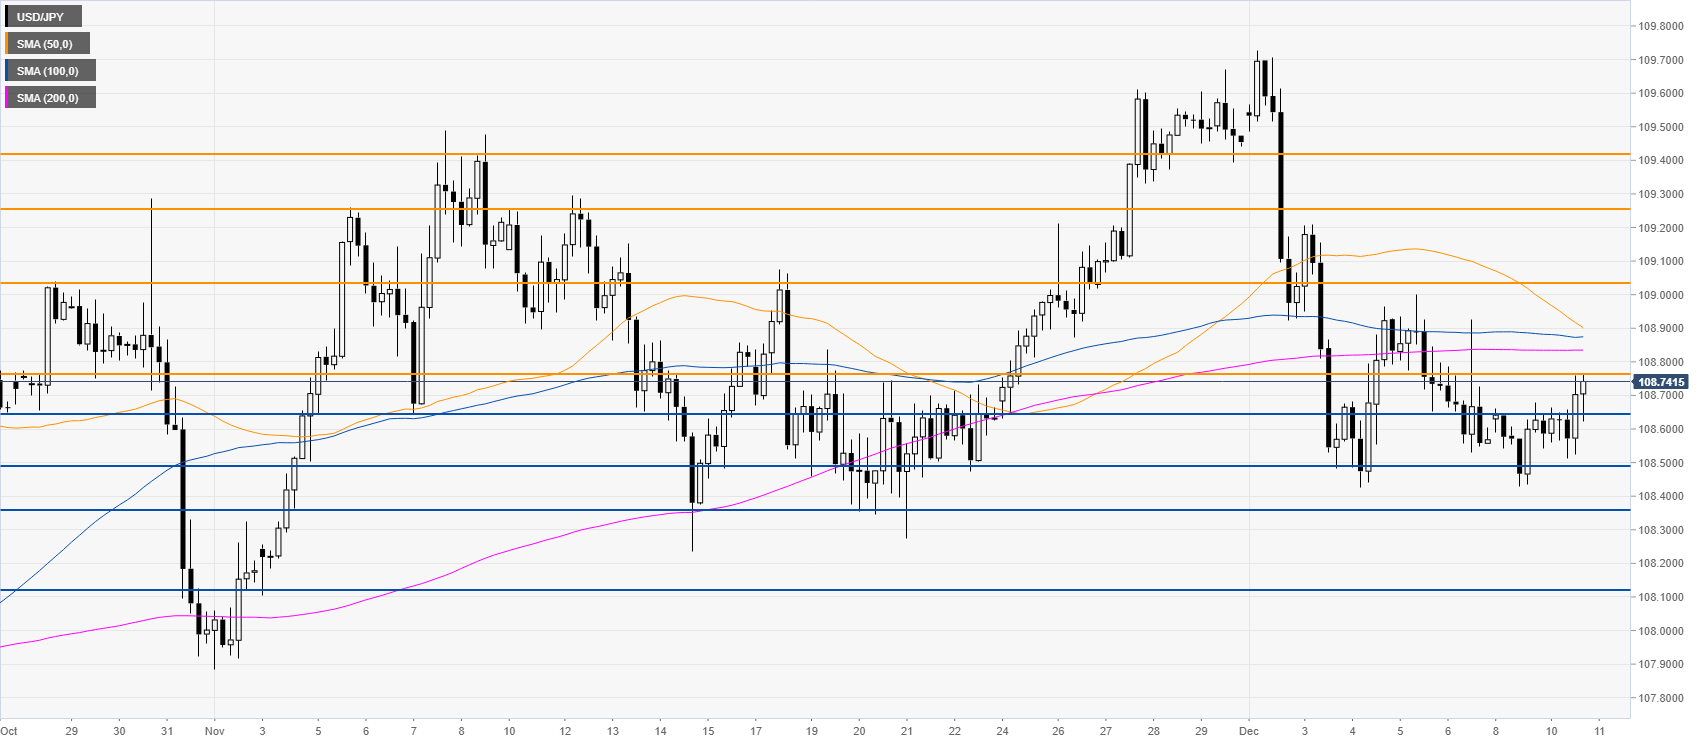
USD/JPY four-hour chart
The spot is correcting the decline seen at the start of December while trading below the main SMAs. A daily close below the 108.64 support can see the market decline towards the 108.47/36 zone and 108.13 level, according to the Technical Confluences Indicator.
USD/JPY 30-minute chart
The market has been sidelined for five consecutive trading sessions. Resistances are seen near 108.76, 109.03, 109.26 and 109.43 price levels, according to the Technical Confluences Indicator.

Additional key levels