GBP/USD Technical Analysis: Doji on H4, overbought RSI check buyers, October top in focus
- GBP/USD takes the bids to six week high.
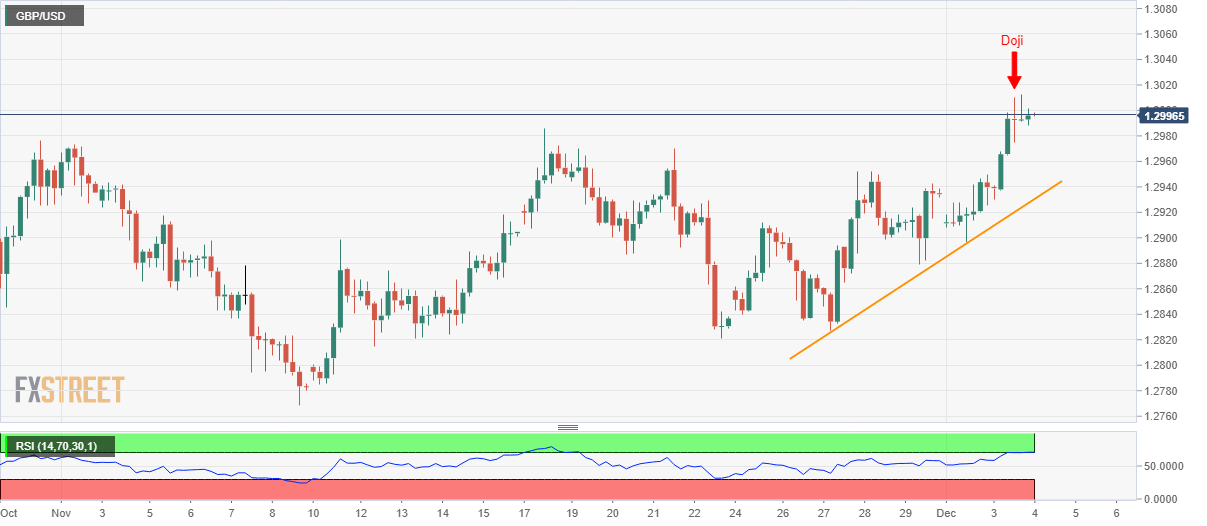
- Prices recently failed to cross October month’s peak, RSI in overbought conditions.
- An upside break can avail 1.3050 as an intermediate halt prior to aiming at May top.
GBP/USD revisits 1.3000 psychological magnets during its initial run-up amid Wednesday morning in Asia. The quote earlier stepped back from October highs with a bearish candlestick formation on the four hour (H4) chart and overbought conditions of 14-bar Relative Strength Index (RSI).
The pair’s repeated failures to stay strong beyond October high adds to the bearish catalysts and indicate another pullback to November month high near 1.2986 ahead of highlighting November 28 top near 1.2950.
During the additional declines, a one-week-old rising trend line at 1.2927 becomes the key as a break of which could recall sub-1.2900 area on the chart.
Alternatively, pair’s ability to cross 1.3015 enables it to question May 10 high near 1.3050 while targeting the May month pear around 1.3180.
GBP/USD four-hour chart
Trend: Pullback expected