20 Nov 2019
US Dollar Index Technical Analysis: DXY trading at two-day highs ahead of FOMC minutes
- DXY has been challenging the 98.00 handle ahead of the FOMC minutes.
- The level to beat for bulls is the 98.00 handle followed by 98.20 and 98.40 price levels.
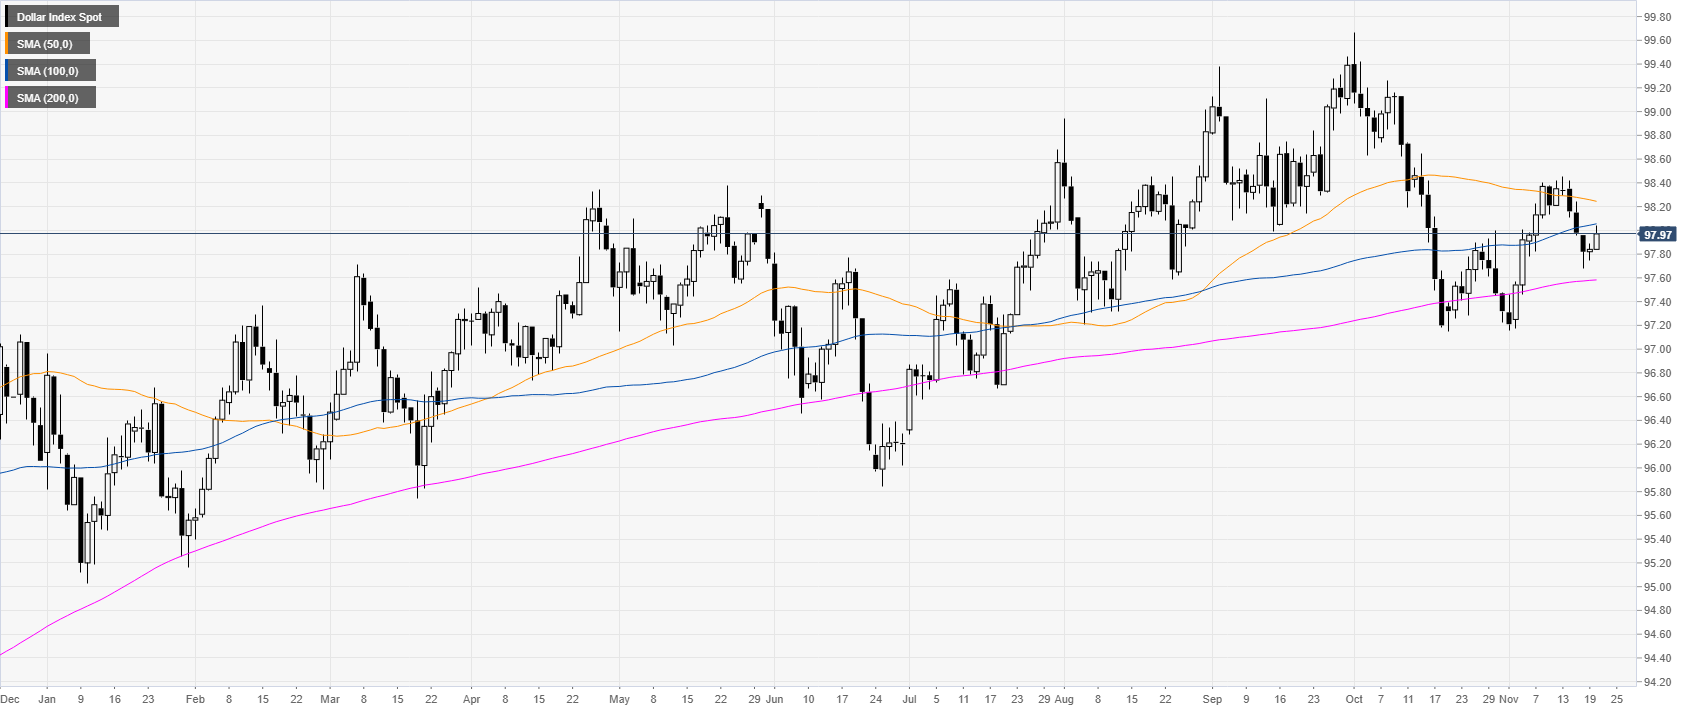
DXY daily chart
DXY (US Dollar Index) is trading in a bull trend above the 200-day simple moving average (DMA). This Wednesday, the market is grinding higher ahead of the FOMC minutes at 19:00 GMT.
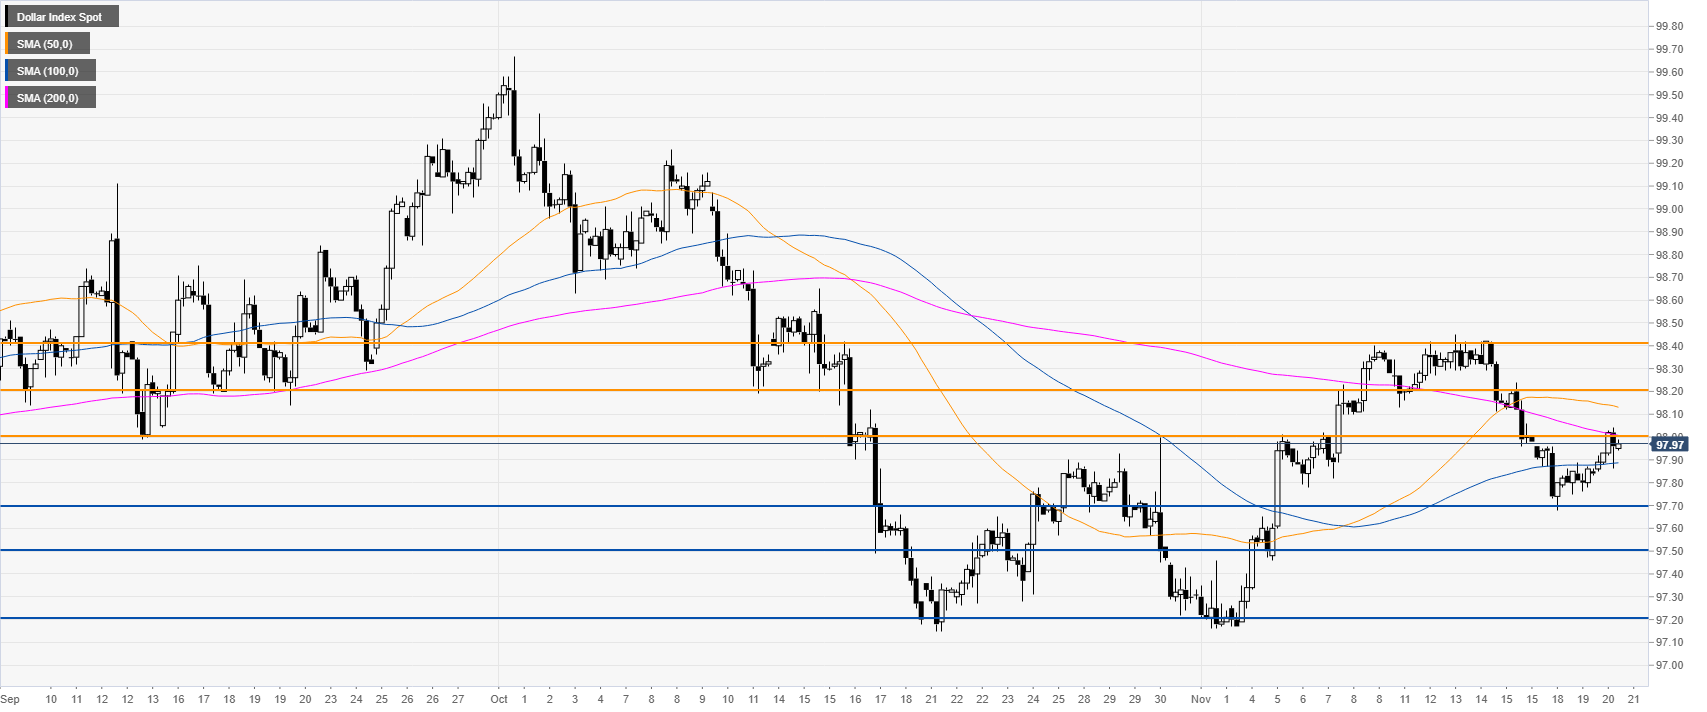
DXY 4-hour chart
DXY is challenging the 98.00 handle and the 200 SMA. As the market is rebounding a break above the 98.00 level can lead to further gains towards the 98.20 and 98.40, near the November highs.
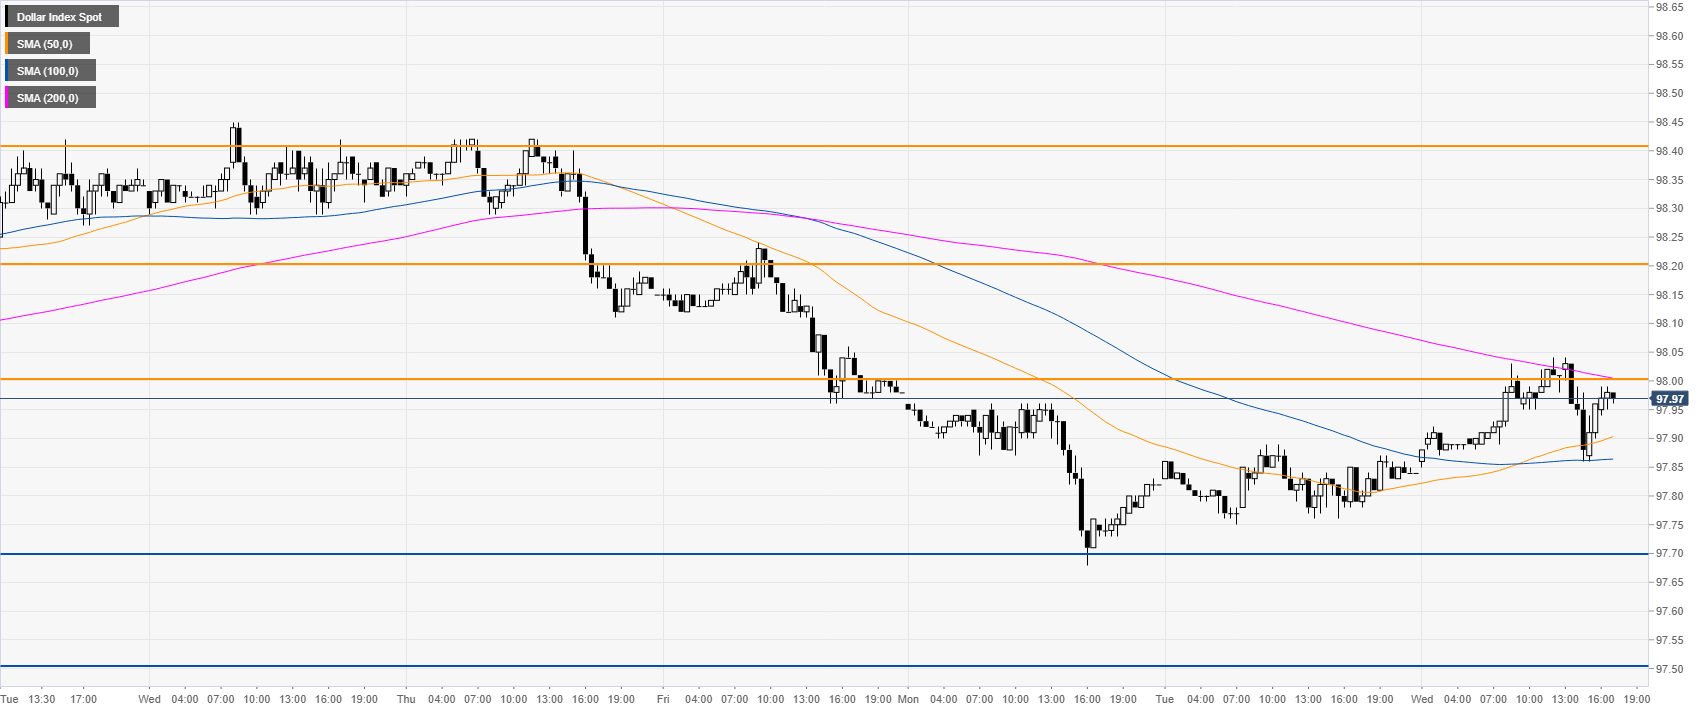
DXY 30-minute chart
The greenback is trading above the 50/100 SMA, suggesting a potential correction up in the medium term. However, 97.70 needs to hold prices, to prevent the market to drop back towards the 97.50 level.
Additional key levels