GBP/USD technical analysis: Bulls challenge 1-month old descending trend-channel resistance
- Gains some follow-through traction and climbs to over two-week tops.
- The set-up seems tilted in favour of bulls, albeit warrant some caution.
The GBP/USD pair gained some follow-through traction through the early European session on Monday and climbed to over two-week tops, around the 1.2960 region in the last hour.
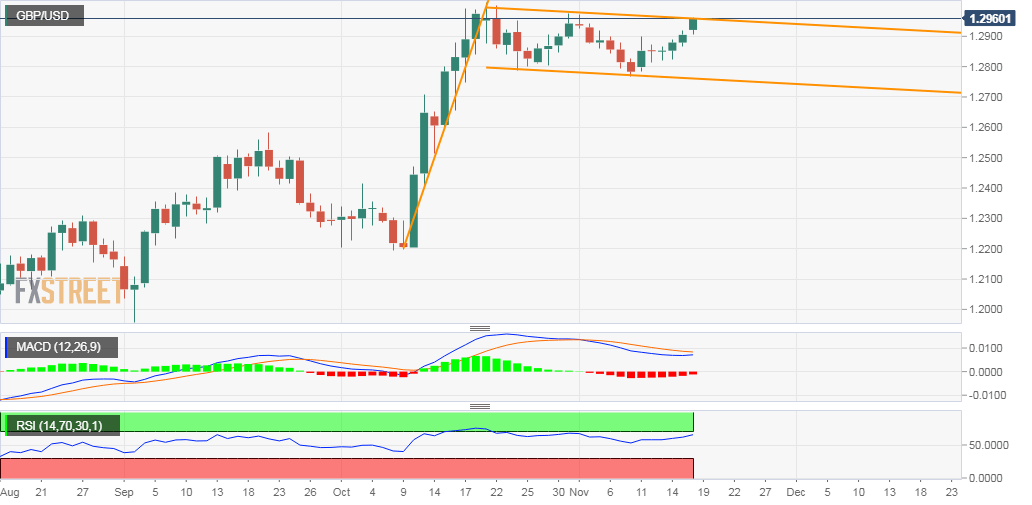
Bulls might now be looking to build on the momentum further beyond a one-month-old descending trend-channel, which constitutes towards the formation of a bullish flag chart pattern.
Meanwhile, technical indicators on the daily chart maintained their bullish bias but are flashing slightly overbought conditions on hourly charts and thus, warrant some caution.
Hence, any subsequent move beyond monthly swing high resistance near the 1.2970-75 region might confront some stiff resistance and remain capped near the key 1.30 psychological mark.
On the flip side, immediate support is now pegged near the 1.2900 mark and is closely followed by the 1.2880-75 region, below which the pair might drift back toward the 1.2800 handle.
GBP/USD daily chart