AUD/NZD Technical Analysis: On the bids above 21-day SMA, bulls target 1.0900
- AUD/NZD recovers the previous day’s losses.
- A recent high, seven-month-old rising trend line acts as near-term key resistances.
- An ascending support line since late-August can question sellers below 21-day SMA.
With the 21-day SMA limiting the AUD/NZD pair’s immediate declines, the quote takes the bids to 1.0810 while heading into the European session on Tuesday.
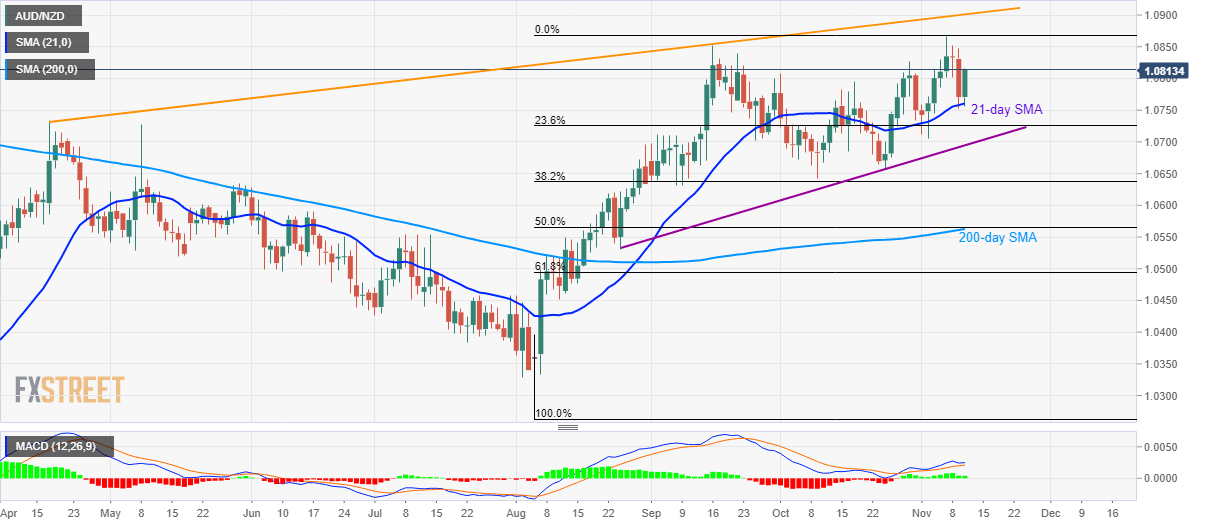
The monthly high around 1.0870 is likely to target of the short-term buyers while an upward sloping trend line since April 17, at 1.0900, could lure bulls afterward.
Should there be increased upside beyond 1.0900, October 2018 high close to 1.1000 will return to the chart.
Meanwhile, pair’s declines below 21-day Simple Moving Average (SMA) level of 1.0760 can take rest on a rising support line since August 26, at 1.0700 now.
If sellers refrain from respecting 1.0700 mark, August 22 high close to 1.0620 may entertain them ahead of 1.0565/50 confluence including 200-day SMA and 50% Fibonacci retracement of the latest rise since August.
AUD/NZD daily chart
Trend: Bullish