7 Nov 2019
AUD/USD technical analysis: Aussie erasing parts of daily gains, trading below the 0.6900 handle
- The Aussie is easing from the daily highs in the New York session.
- Support is seen at the 0.6870 price level.
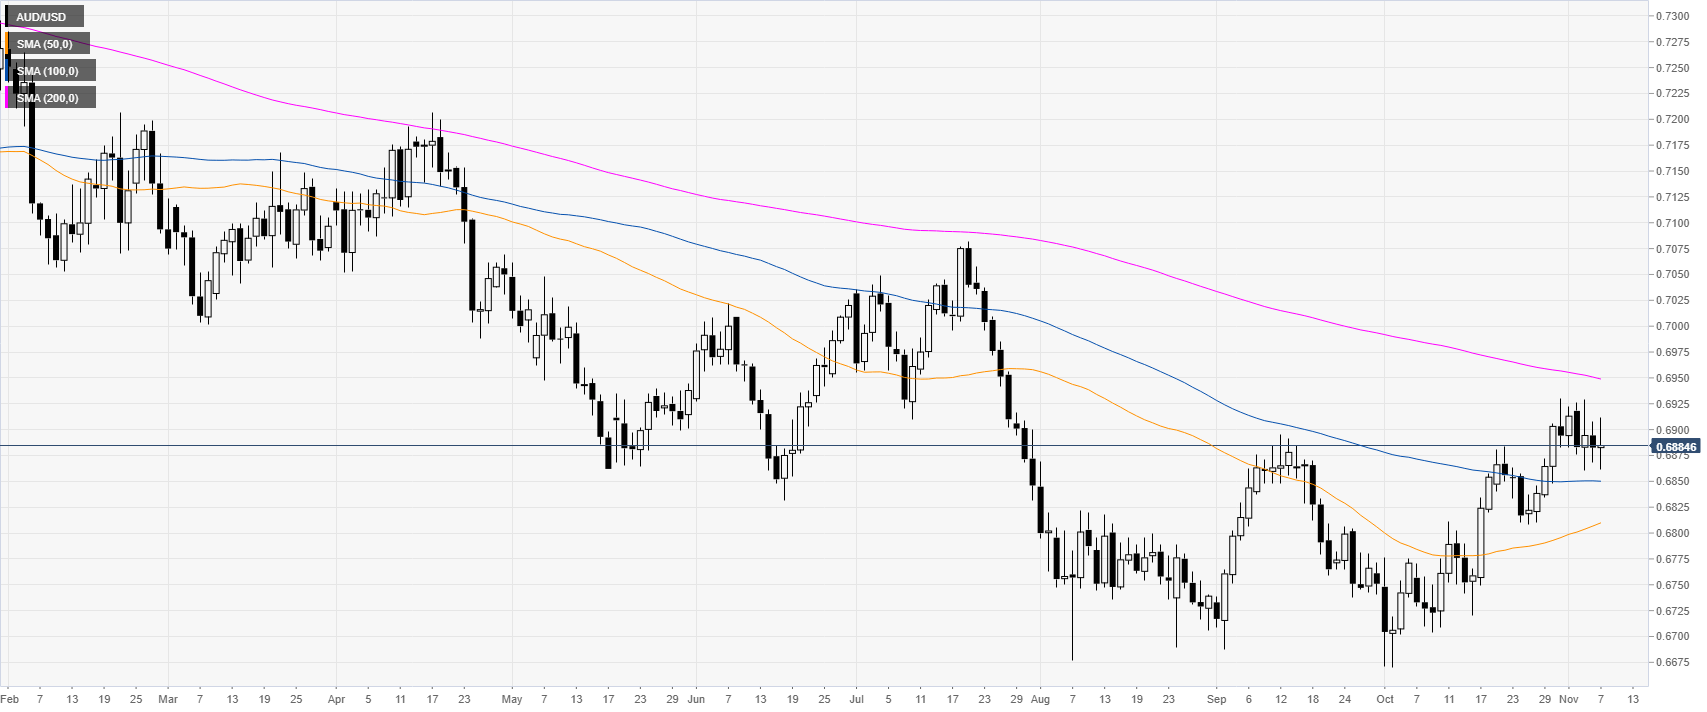
AUD/USD daily chart
The Aussie is trading in a bear trend below the 200-day simple moving average (DMA) on the daily chart. This Thursday the Aussie is trading back below the 0.6900 figure in the New York session.
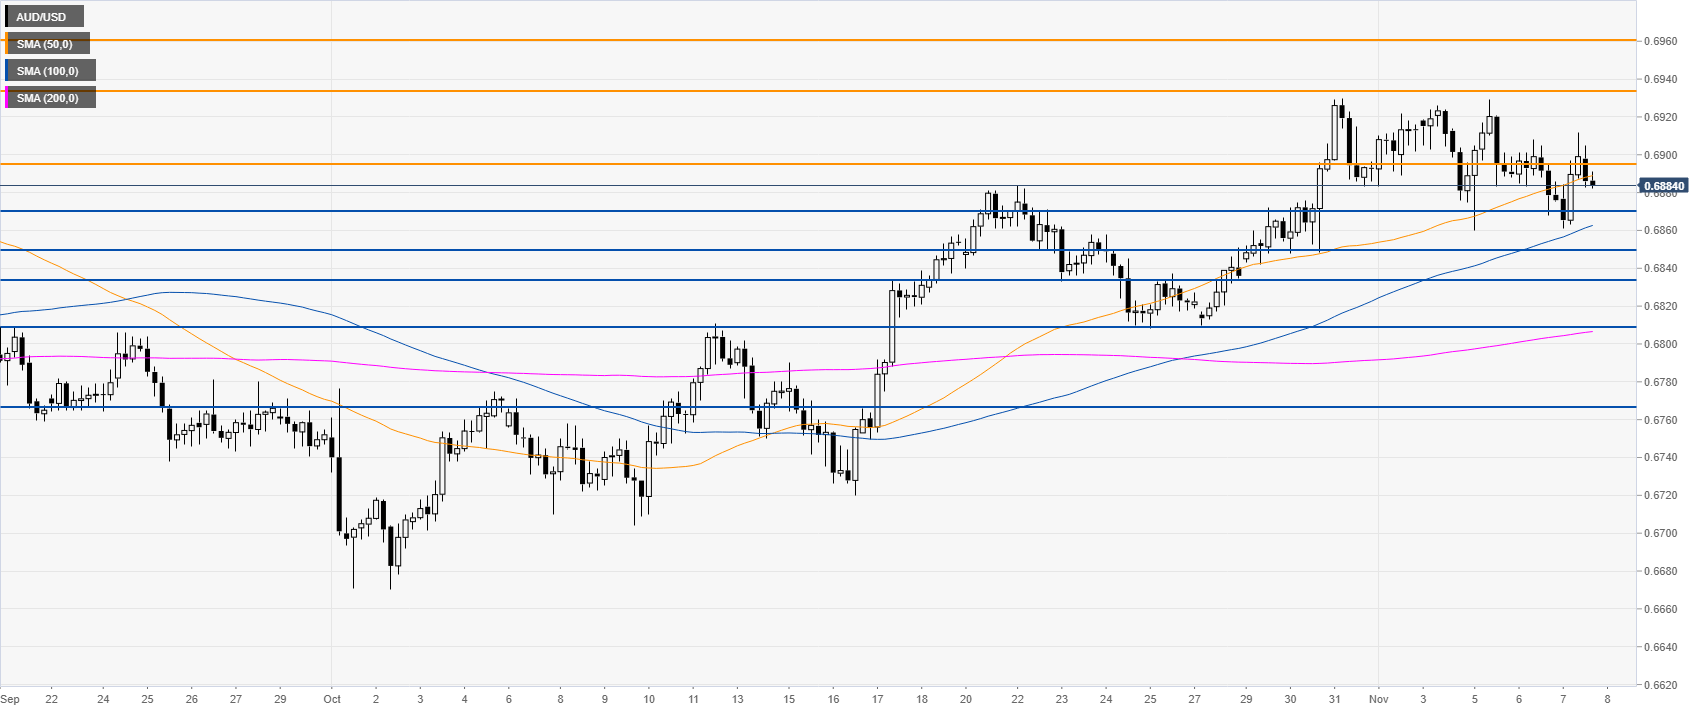
AUD/USD 4-hour chart
The market in November is so far consolidating the October gains. The last month's rally is stalling as the USD is gaining strength across the board.
However, the Aussie is trading above upward sloping 100 and 200 SMAs, suggesting a bullish bias in the medium term.
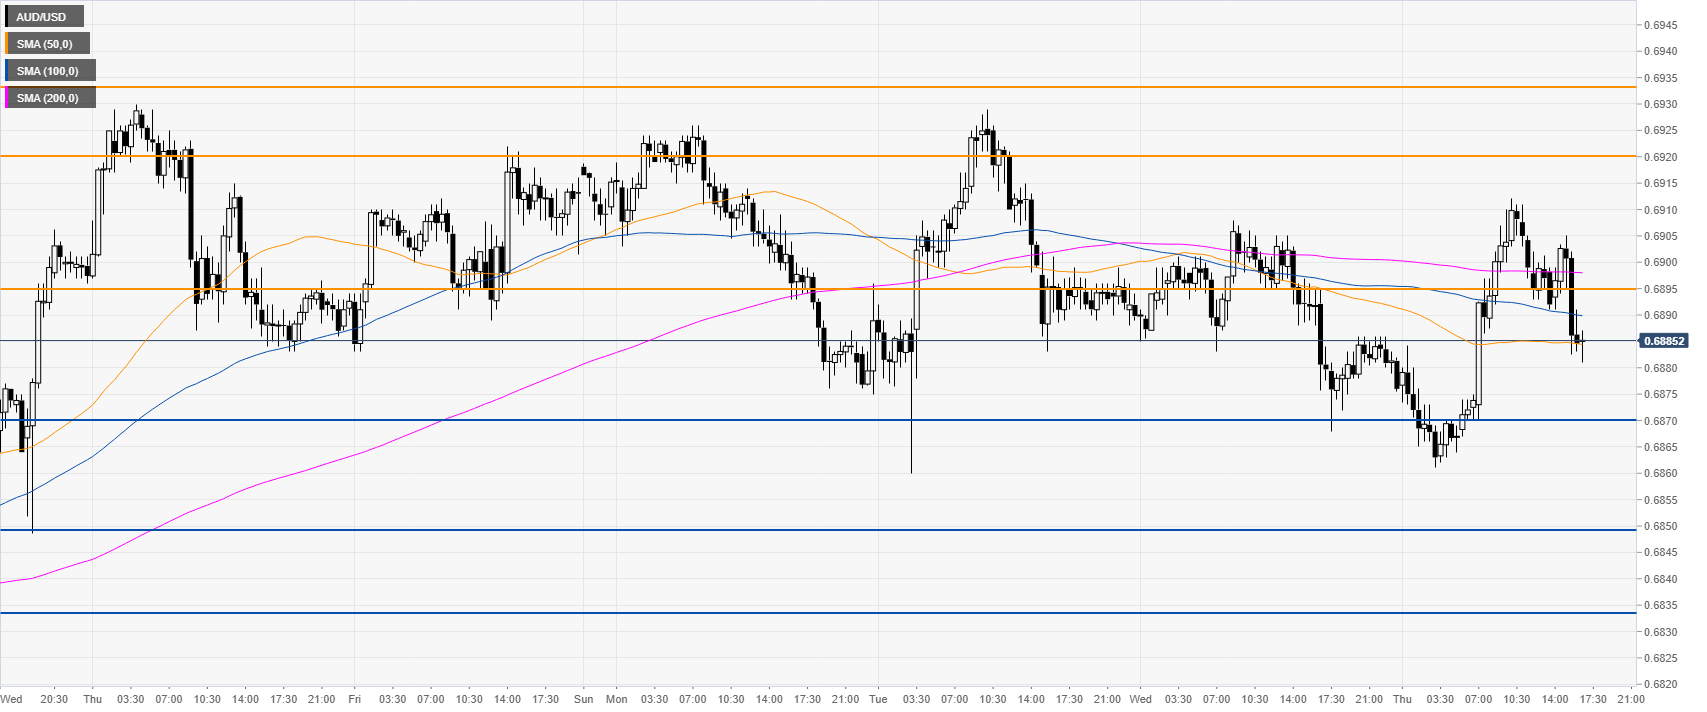
AUD/USD 30-minute chart
The spot is reversing down from the daily highs while trading below its main SMAs. The market could decline towards the 0.6870 level. Further down lies the 0.6850 level. Resistances are seen at the 0.6895 level followed by 0.6920, according to the Technical Confluences Indicator.
Additional key levels