25 Oct 2019
EUR/USD technical analysis: Euro on track to register its worst weekly decline since late September
- The Euro remains on the back foot as the week is coming to an end.
- The level to beat for bears is the 1.1105/1.1092 support zone.
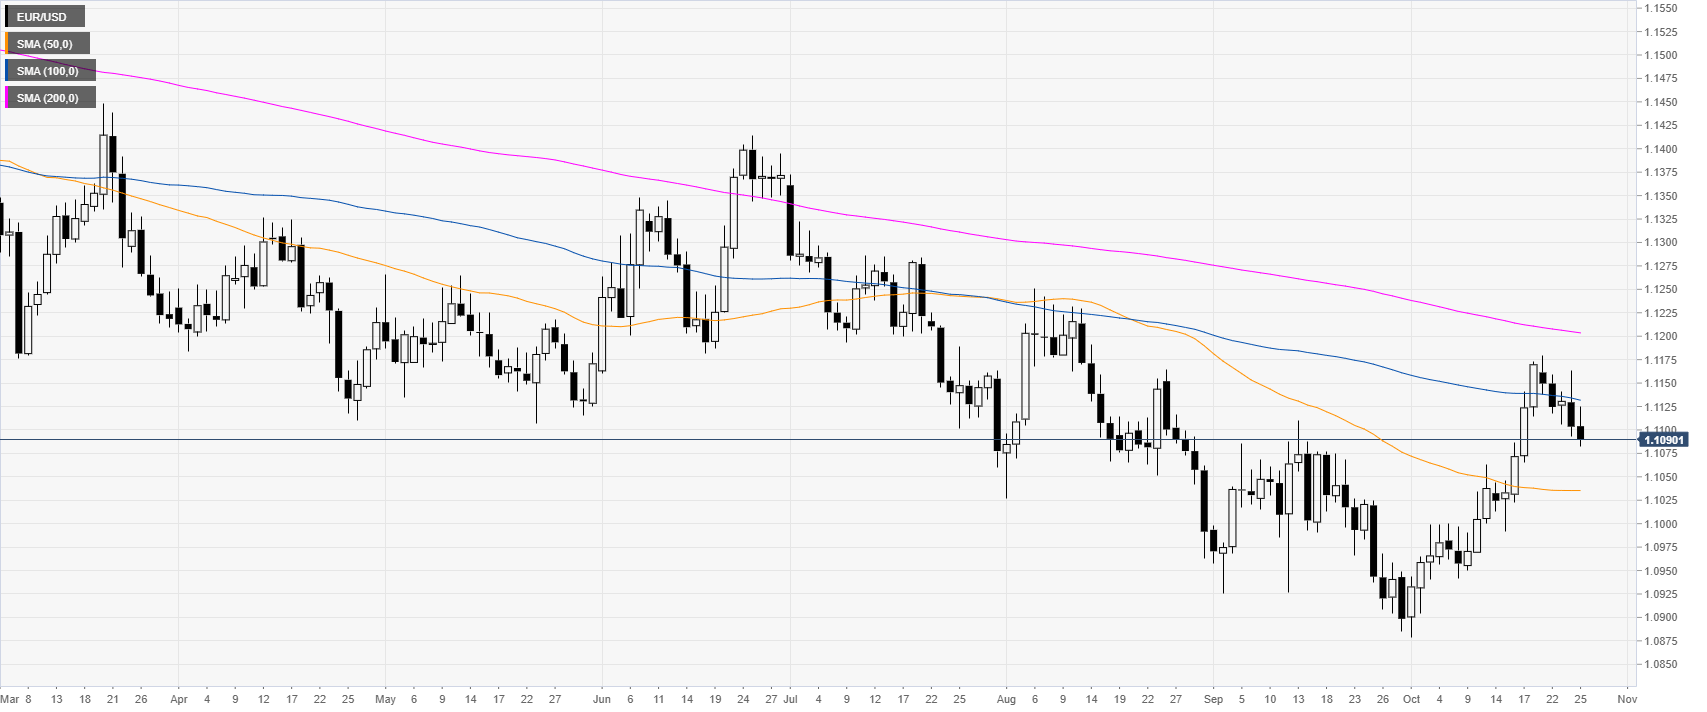
EUR/USD daily chart
On the daily chart, the common currency is trading in a downtrend below its 100 and 200-day simple moving averages (DMAs). EUR/USD is about to register its worst weekly decline since late September this year.
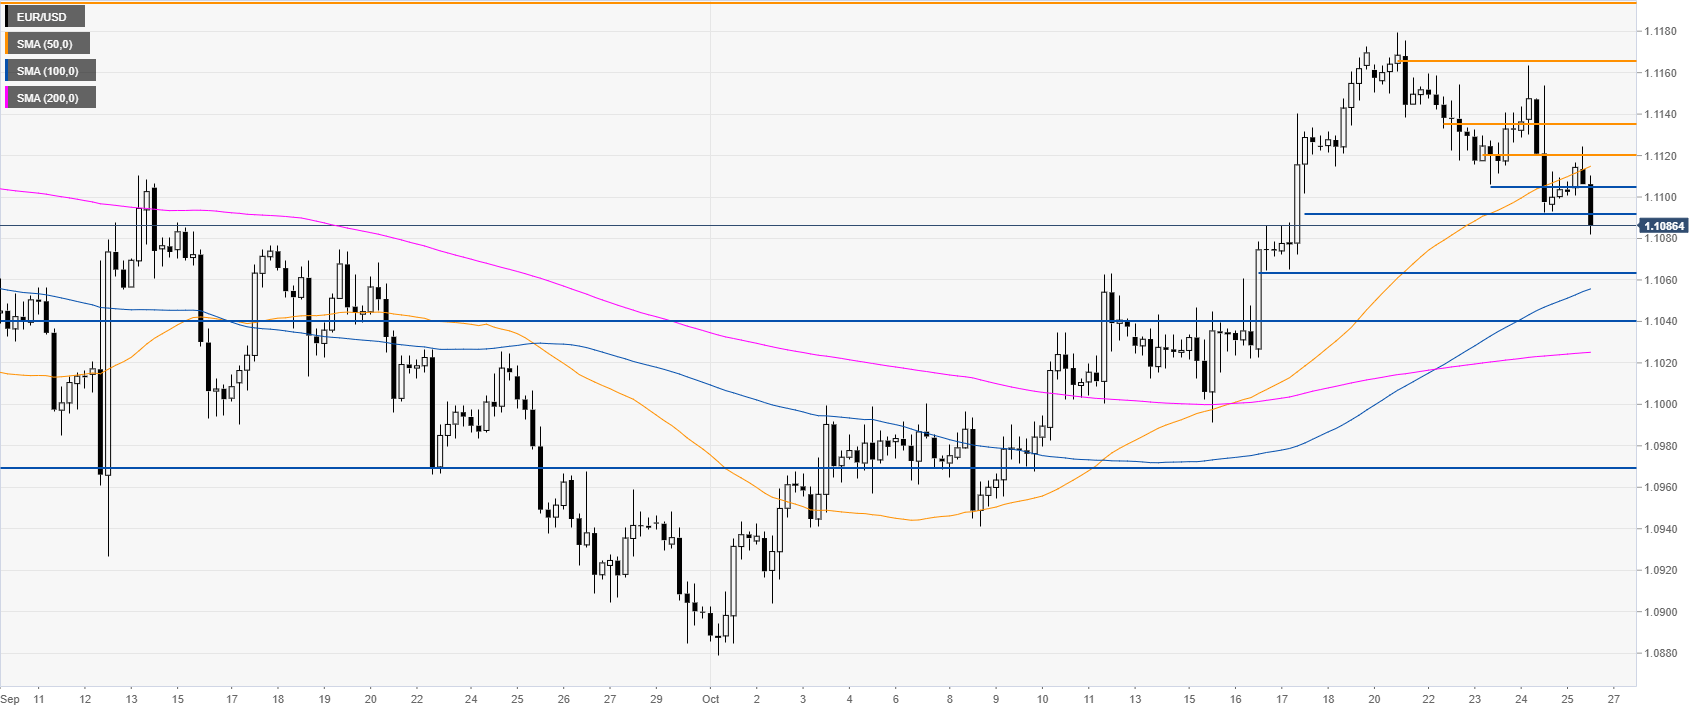
EUR/USD four-hour chart
The Fiber, on the four-hour chart, is trading above the 100 and 200 SMAs. However, the spot is retracing down, trading below the 50 SMA. In order to confirm the correction, sellers should break below the 1.1105/1.1092 support zone on a daily closing basis. A successful break below this area could send the Euro to the 1.1090 and 1.1065 price levels, according to the Technical Confluences Indicator.
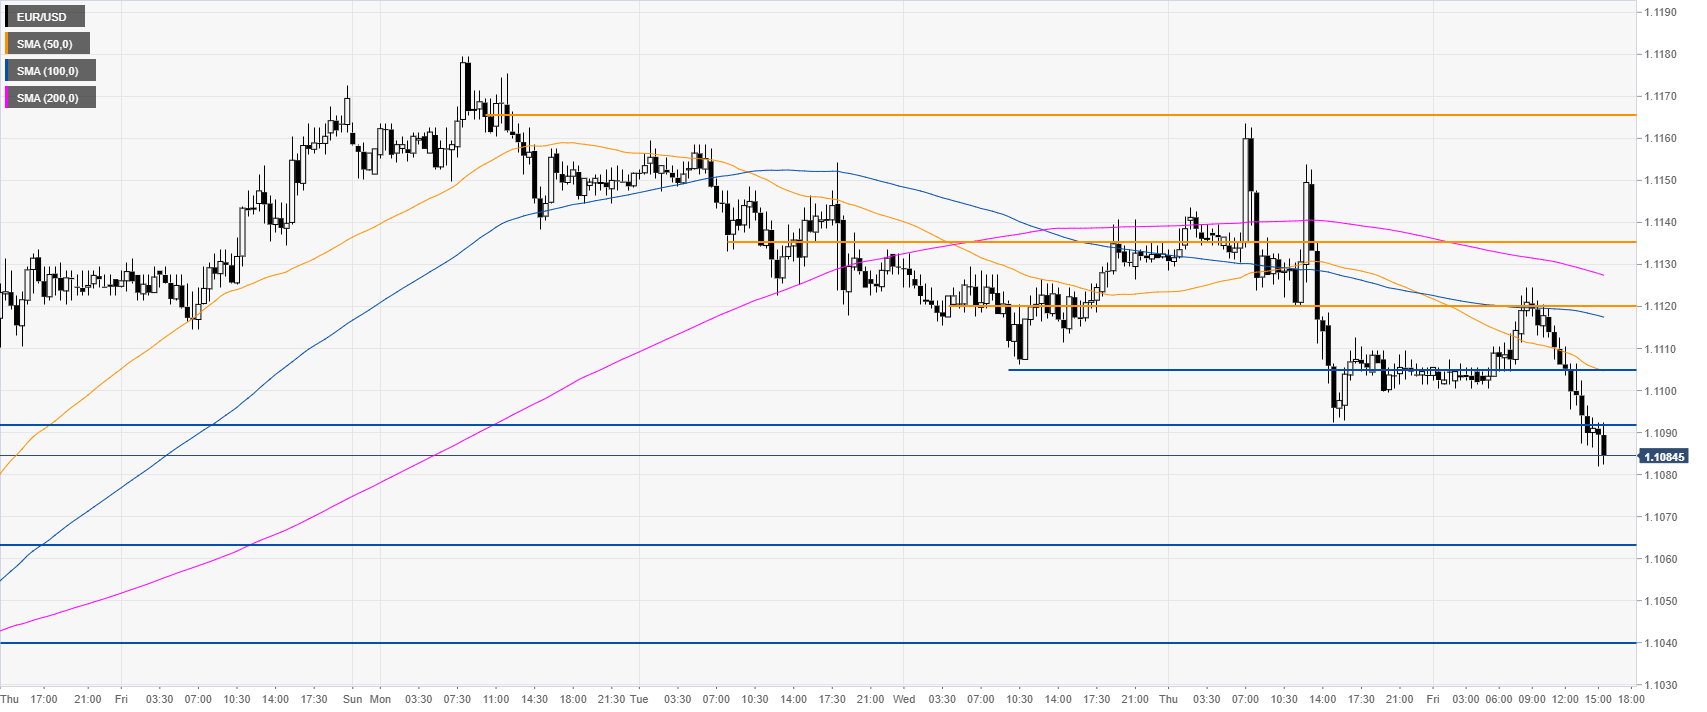
EUR/USD 30-minute chart
The exchange rate is trading below the main SMAs on the 30-minute chart, suggesting bearish bias in the near term. Resistance can be seen at the 1.1092/1.1120 and 1.1135 price level.
Additional key levels