AUD/USD technical analysis: 0.6805/6800 becomes the level to beat for sellers
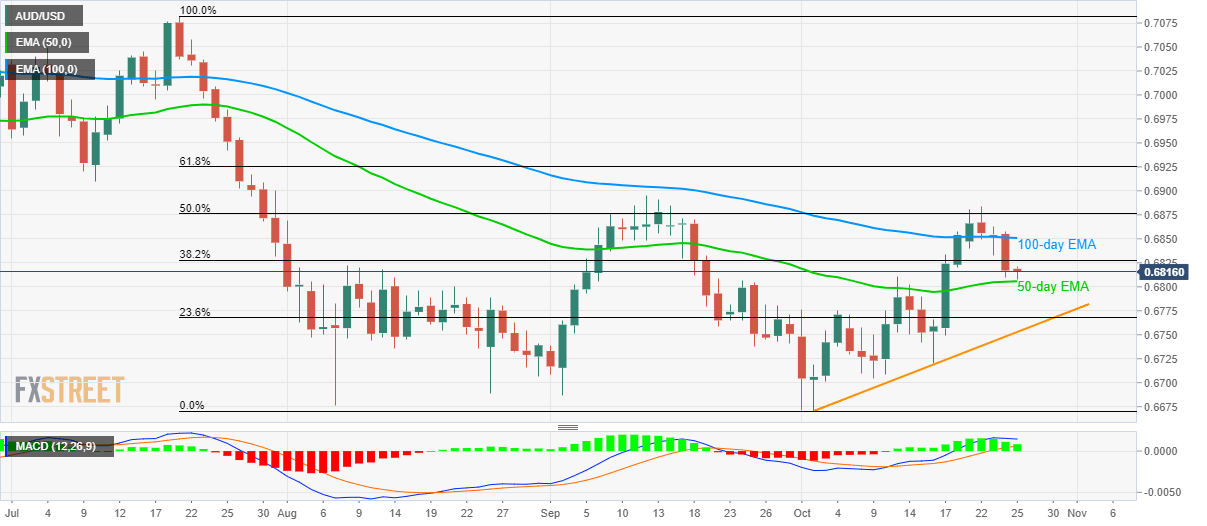
- AUD/USD fails to decline below 50-day EMA, multiple tops since late-September.
- 38.2% Fibonacci retracement, 100-day EMA acts as immediate resistance.
While failure to cross 50% Fibonacci retracement of July-October downside dragged the AUD/USD pair to weekly low, pair’s further downside seems questionable as it takes the rounds to 0.6815 amid initial trading session on Friday.
Among the downside support, 50-day Exponential Moving Average (EMA) and multiple highs marked since late-Septembers to question the sellers around 0.6805/6800. Also increasing the odds for the pair’s rise are bullish signals from 12-bar Moving Average Convergence and Divergence (MACD).
As a result, buyers can confront 38.2% Fibonacci retracement of 0.6830 during the run-up to a 100-day EMA level of 0.6850.
However, the pair’s near-term strength will be judged on the basis of its ability to cross 50% Fibonacci retracement level near 0.6880.
Alternatively, pair’s declines below 0.6800 can take rest on 23.6% Fibonacci retracement level close to 0.6765 whereas an upward sloping trend line since October 02, at 0.6752 now, could limit downside afterward.
AUD/USD daily chart
Trend: pullback expected