24 Oct 2019
GBP/USD technical analysis: Cable off daily lows, trading sub-1.2880 level
- GBP/USD lost some steam this Thursday as call for snap elections in the UK could cast further uncertainties about Brexit.
- The level to beat for sellers is the 1.2815/1.2772 support zone.
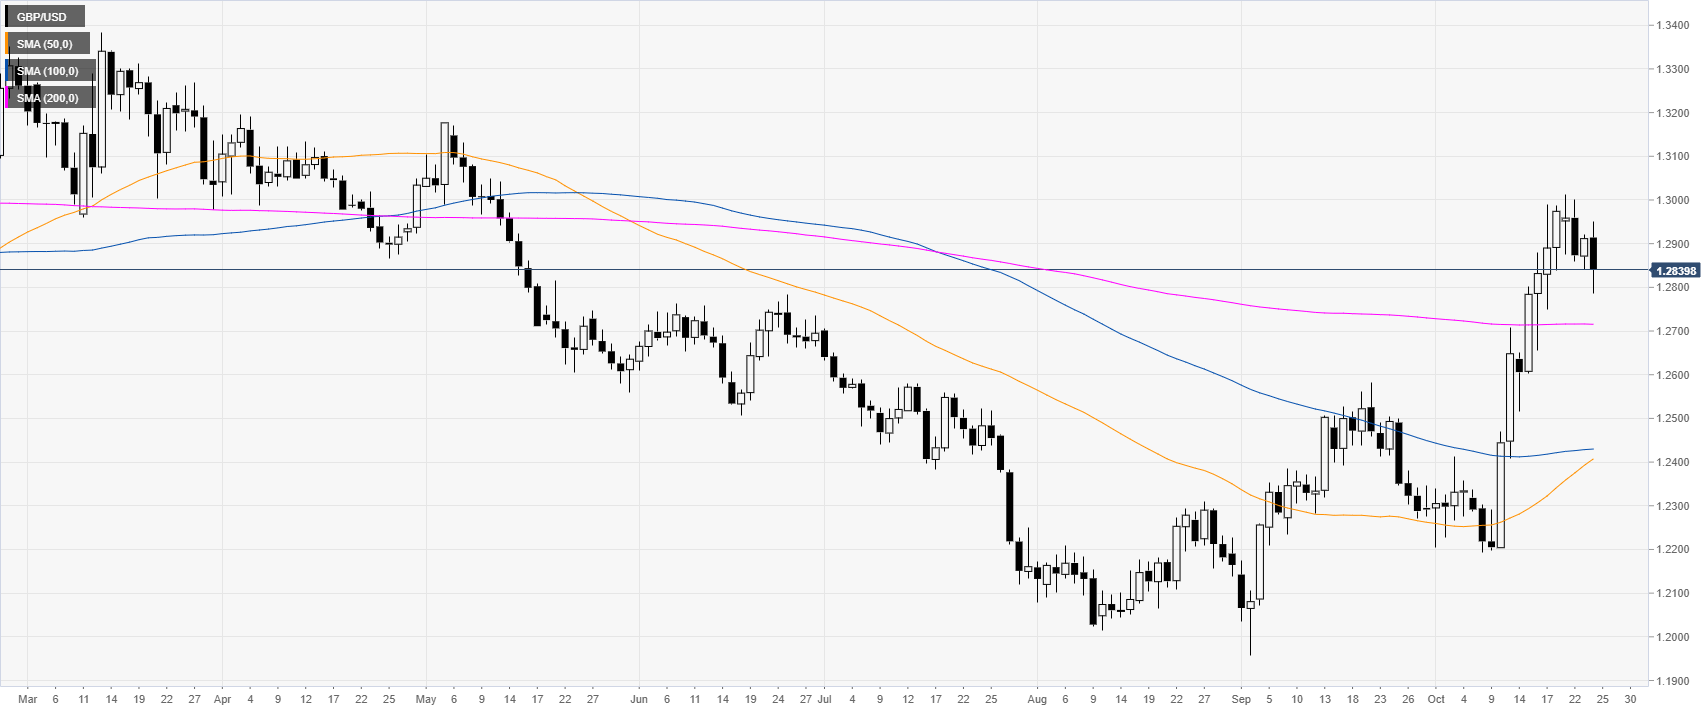
GBP/USD daily chart
The Pound in October spiked above its main daily simple moving averages (DSMAs) and reached levels not seen since mid-May 2019. The Brexit headlines are the main catalysts behind the GBP/USD moves. UK PM Johnson calls for snap election on Dec. 12, GBP/USD slumps to 1.28.
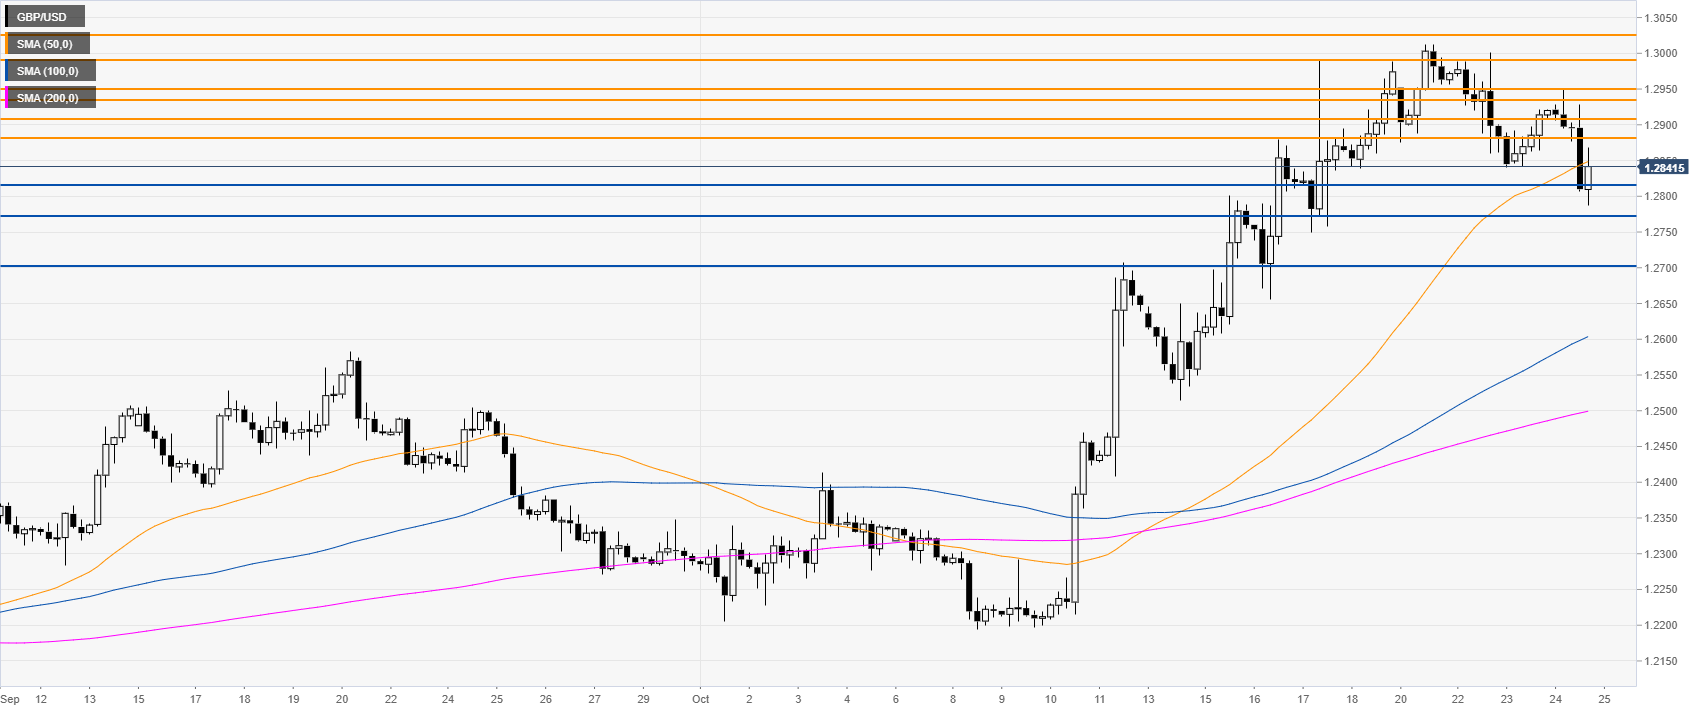
GBP/USD four-hour chart
The Pound is trading in a bull channel above the 100 and 200 SMAs. However, GBP/USD is retracing down, below the 1.2900 handle and the 50 SMA. Sellers need to break the 1.2815/1.2772 support zone to travel towards the 1.2700 handle, according to the Technical Confluences Indicator.
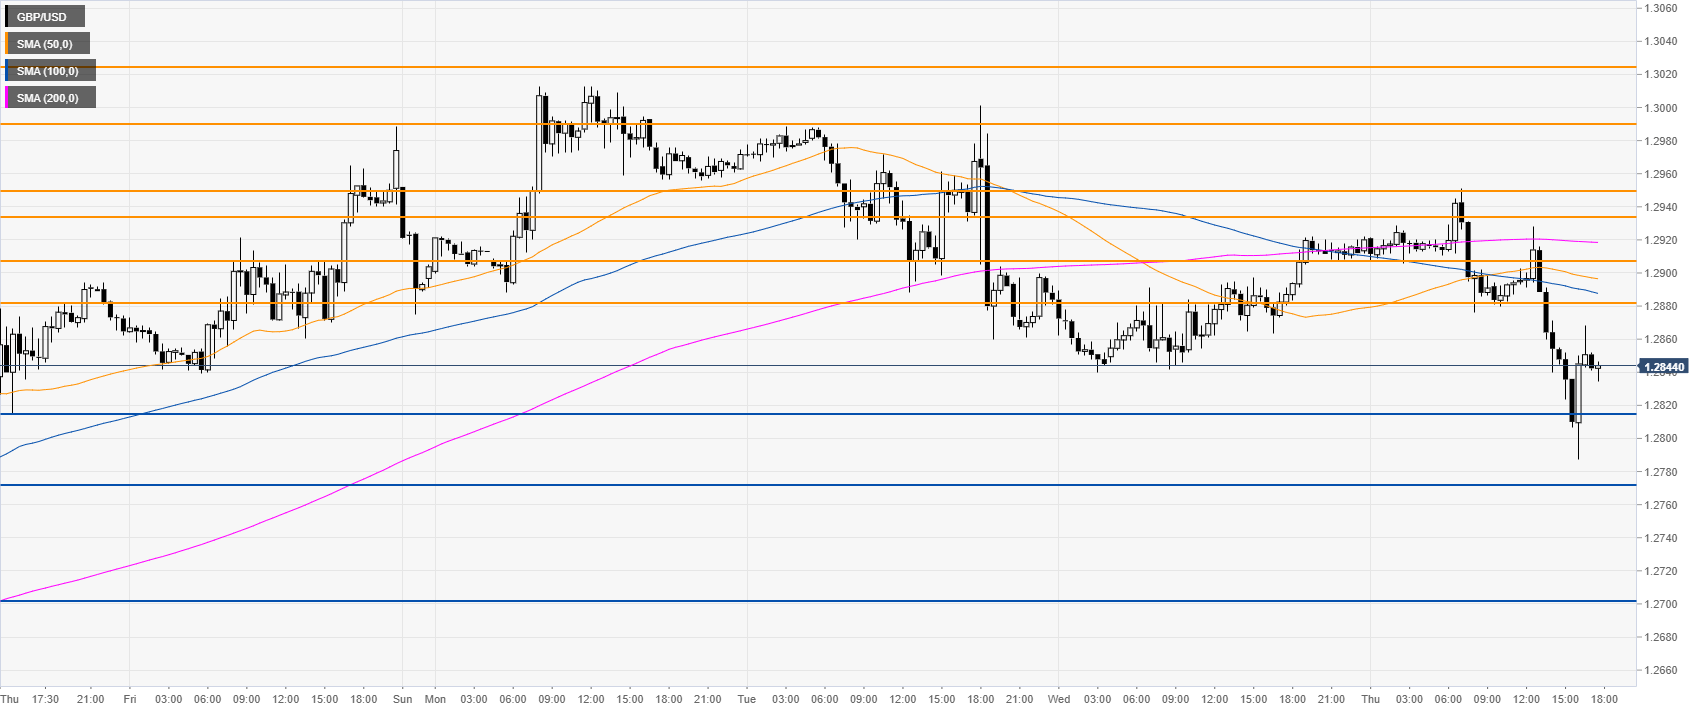
GBP/USD 30-minute chart
GBP/USD is trading below its main SMAs, suggesting a bearish momentum in the near term. Resistance is seen at 1.2880 and 1.2908, according to the Technical Confluences Indicator.
Additional key levels