22 Oct 2019
USD/INR technical analysis: Under pressure below 50-day EMA, 38.2% Fibo.
- USD/INR trades near one-week low amid failure to rise beyond key technical indicators.
- 70.40/36 gains sellers’ attention for now.
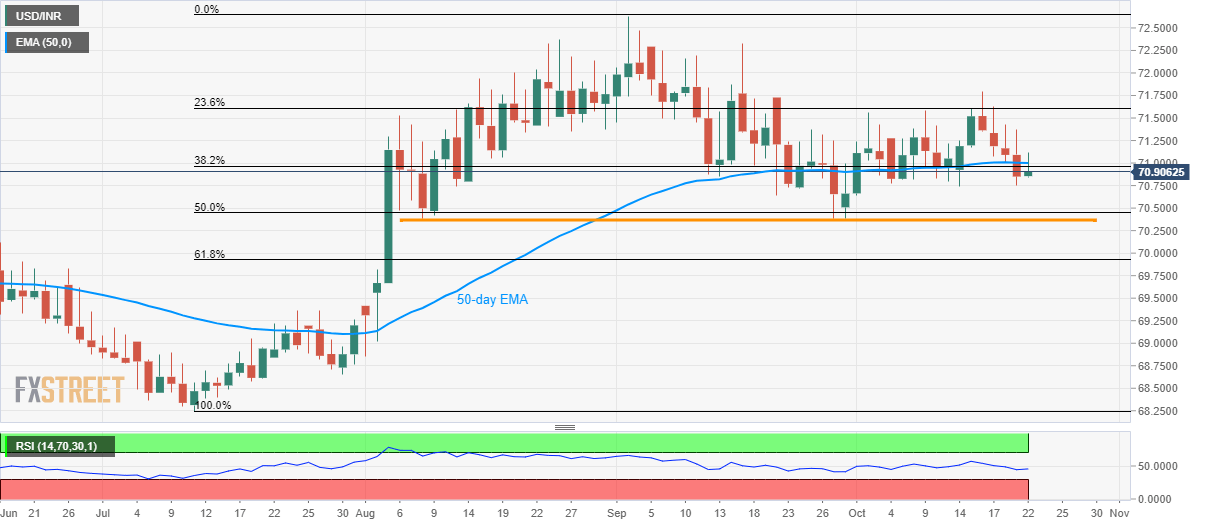
With its failure to cross near-term key resistance-confluence, USD/INR remains under pressure while taking rounds to 70.90 ahead of the European open on Tuesday.
As a result, sellers are targeting 70.40/36 area that comprises of lows marked during August 08 and September 30.
However, pair’s further declines might not refrain from visiting 61.8% Fibonacci retracement level of July-September upside, at 69.93.
Meanwhile, an upside clearance of 70.95/71.00 region including 38.2% Fibonacci retracement level and 50-day Exponential Moving Average (EMA) could challenge 23.6% Fibonacci retracement level around 71.60 prior to aiming the monthly top surrounding 71.80.
USD/INR daily chart
Trend: bearish