USD/IDR technical analysis: 14,200/10 becomes the key upside barrier
- USD/IDR seesaws around the four-week low.
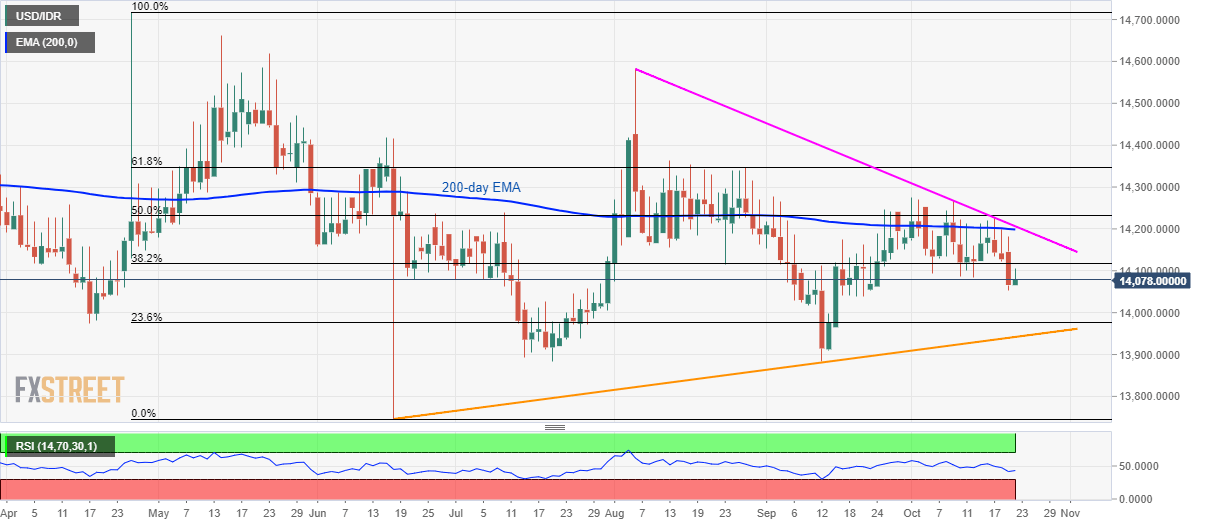
- 38.2% Fibonacci retracement acts as immediate resistance with 14,030 being nearby support.
Despite recovering from the monthly bottom, USD/IDR has many upside barriers to clear before restoring bull’s confidence. The quote is on the bids to 14,080 amid Tuesday morning in Asia.
Among the many resistances, 38.2% Fibonacci retracement level of April-June declines, around 14,120 acts as an immediate upside barrier.
However, a confluence of 200-day Exponential Moving Average (EMA) and a downward sloping trend line since August, around 14,200/10 will be the key to watch as a break of which can trigger pair’s run-up towards 61.8% Fibonacci retracement near 14,350.
On the contrary, multiple lows during mid-September offer immediate support around 14,030 ahead of dragging the quote to 23.6% Fibonacci retracement level of 13,975.
During the pair’s further declines below 13,975, an ascending trend line since June, at 13,940, should be watched carefully.
USD/IDR daily chart
Trend: bearish