GBP/JPY technical analysis: Overbought RSI challenges buyers above 61.8% Fibo.
- GBP/JPY struggles to extend rise beyond the five-month high.
- Overbought RSI conditions doubt bulls relying on the break of 61.8% Fibonacci retracement.
- 200-day SMA grabs market attention during fresh declines.
With its another failure to overcome late-May high, GBP/JPY takes the rounds to 140.80 during the early Asian session on Tuesday.
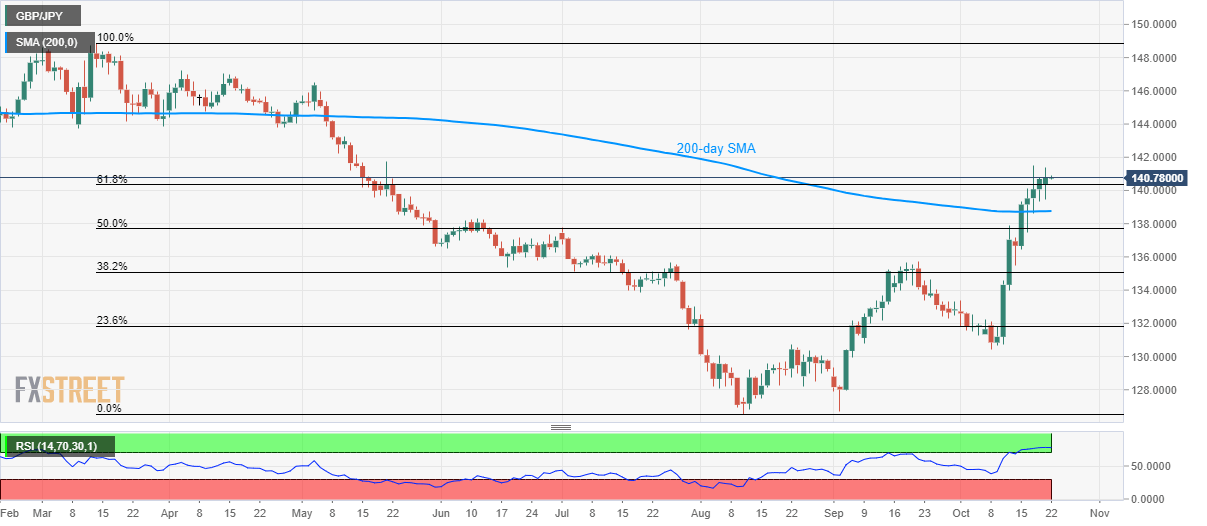
Ever since the quote rose beyond 61.8% Fibonacci retracement of March-August declines, bulls keep firming the odds of clearing May 21 high near 141.75. However, a lower high formation since then, coupled with overbought conditions of 14-bar Relative Strength Index (RSI) signal brighter chances of the pair’s pullback.
In doing so, sellers will wait for a clear break below 61.8% Fibonacci retracement level of 140.34 in order to aim for a 200-day Simple Moving Average (SMA) level of 138.75.
Though, 50% Fibonacci retracement surrounding 137.70 could question the pair’s further downside.
Meanwhile, pair’s rise past-141.75 sets the tone for the further run-up to 142.20 and April month low close to 143.77.
GBP/JPY daily chart
Trend: pullback expected