16 Oct 2019
EUR/USD Technical Analysis: Rallies still capped by the 1.1060/65 band
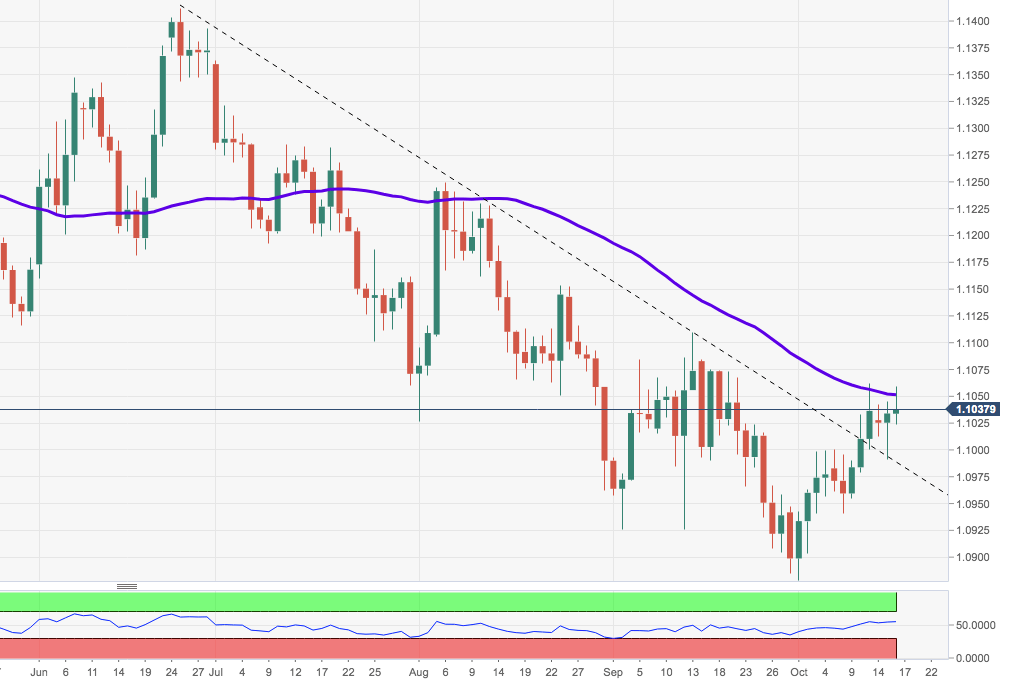
- The recent bull run in EUR/USD met strong hurdle in the 1.1060 region, or monthly tops.
- A surpass of this resistance area should reassert the upside pressure and allow for a probable visit to September’s peak at 1.1109.
- On the other hand, the inability of spot to extend the rally on a sustainable fashion (ideally in the near term) should open the door for some consolidative mood ahead of extra losses to, initially, the 21-day SMA ay 1.0984.
EUR/USD daily chart