8 Aug 2019
GBP/USD technical analysis: Intraday rollercoaster settles near the 1.2135 level
- GBP/USD bear trend remains for the moment intact.
- The levels to beat for bears are seen at 1.2135 and 1.2082 supports.
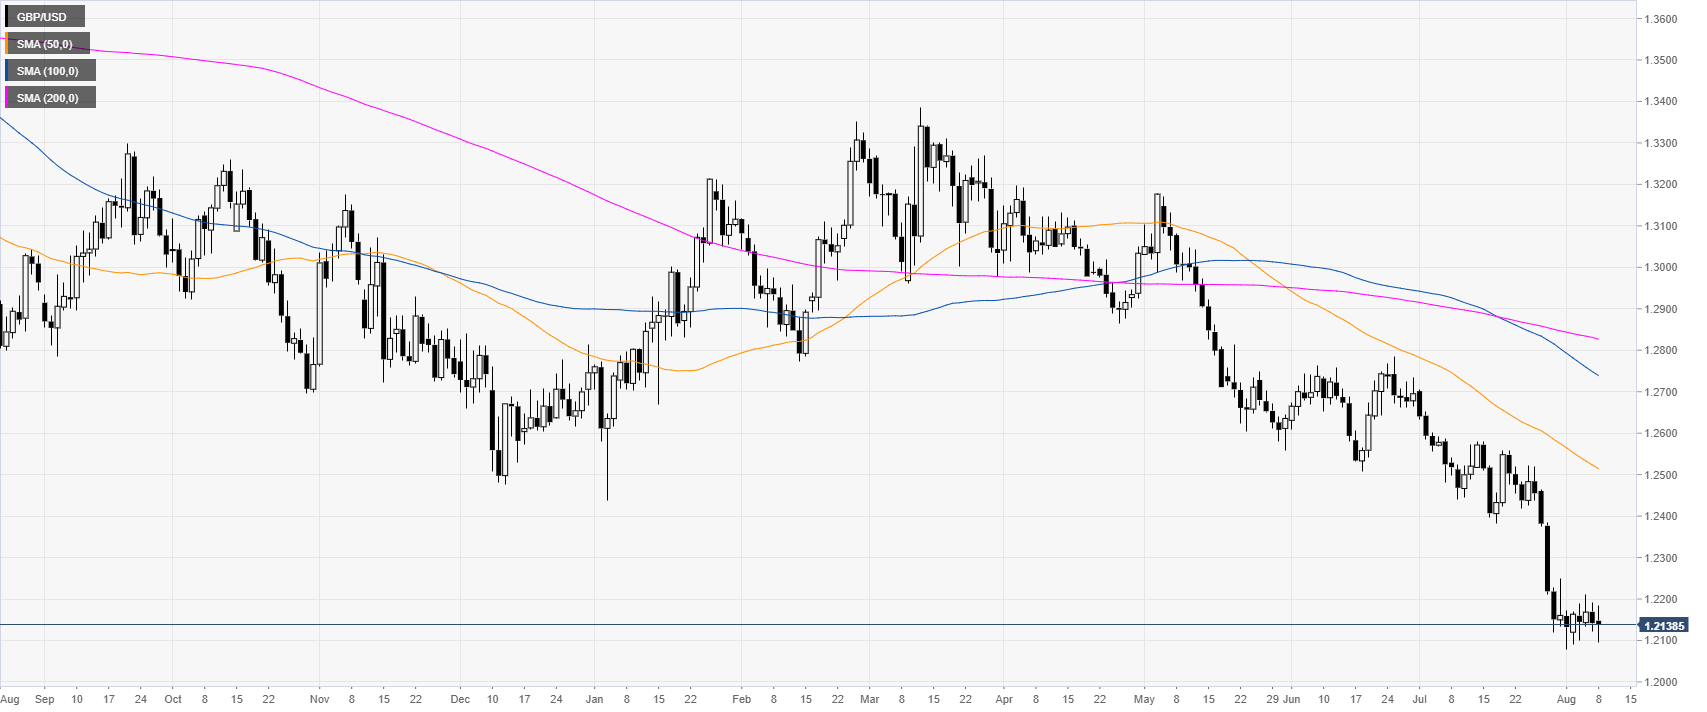
GBP/USD daily chart
Cable is under bearish pressure near multi-month lows as the market is trading below its main daily simple moving averages (DSMAs).
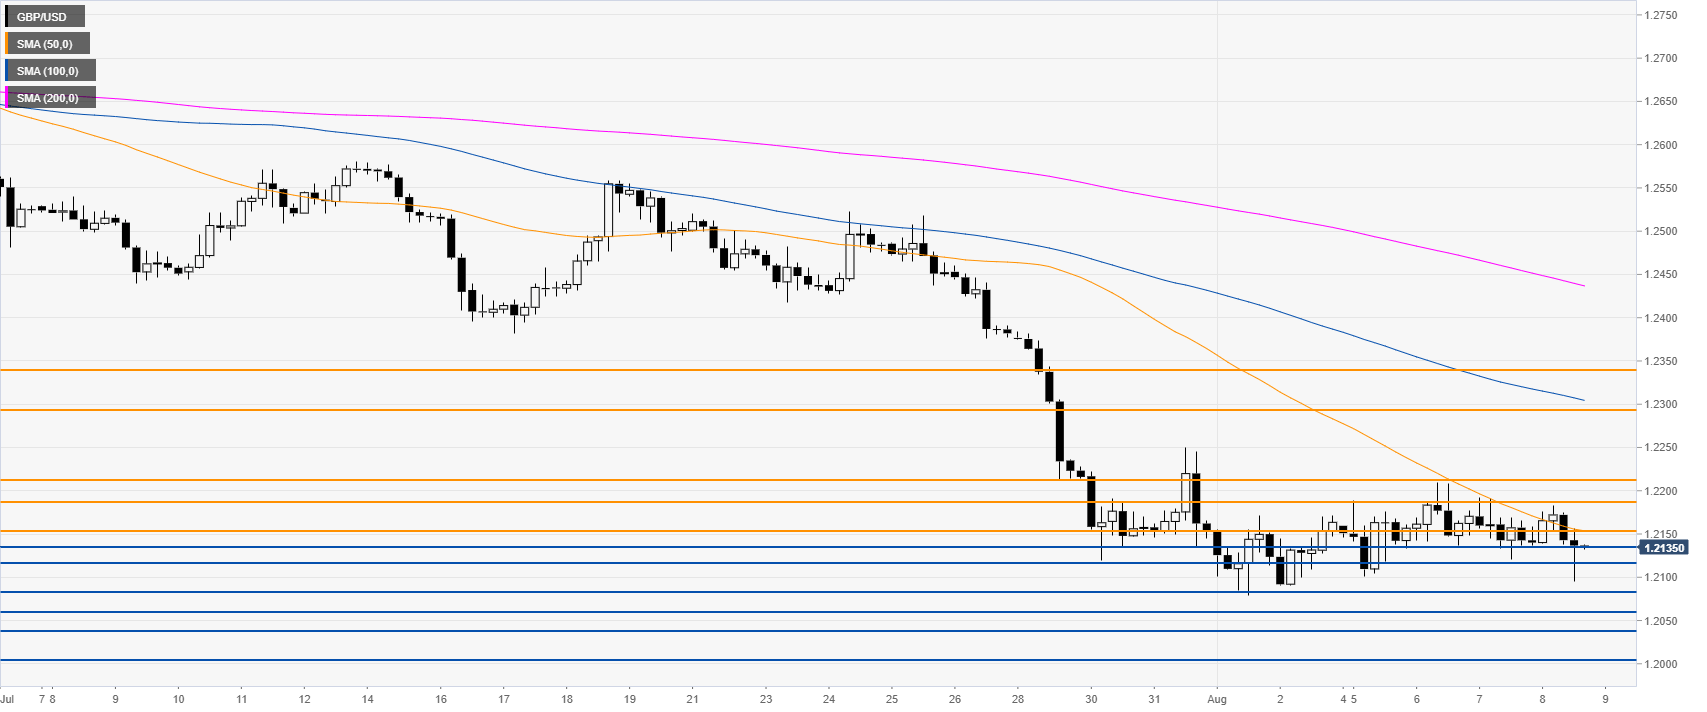
GBP/USD 4-hour chart
GBP/USD is trading below its main SMAs, suggesting bearish momentum in the near term. Bears attempted to break below the 1.2116 support in the New York session. A clear break below this level is necessary for the market to depreciate towards 1.2082, 1.2060, 1.2035 and the 1.2000 figure, according to the Technical Confluences Indicator.
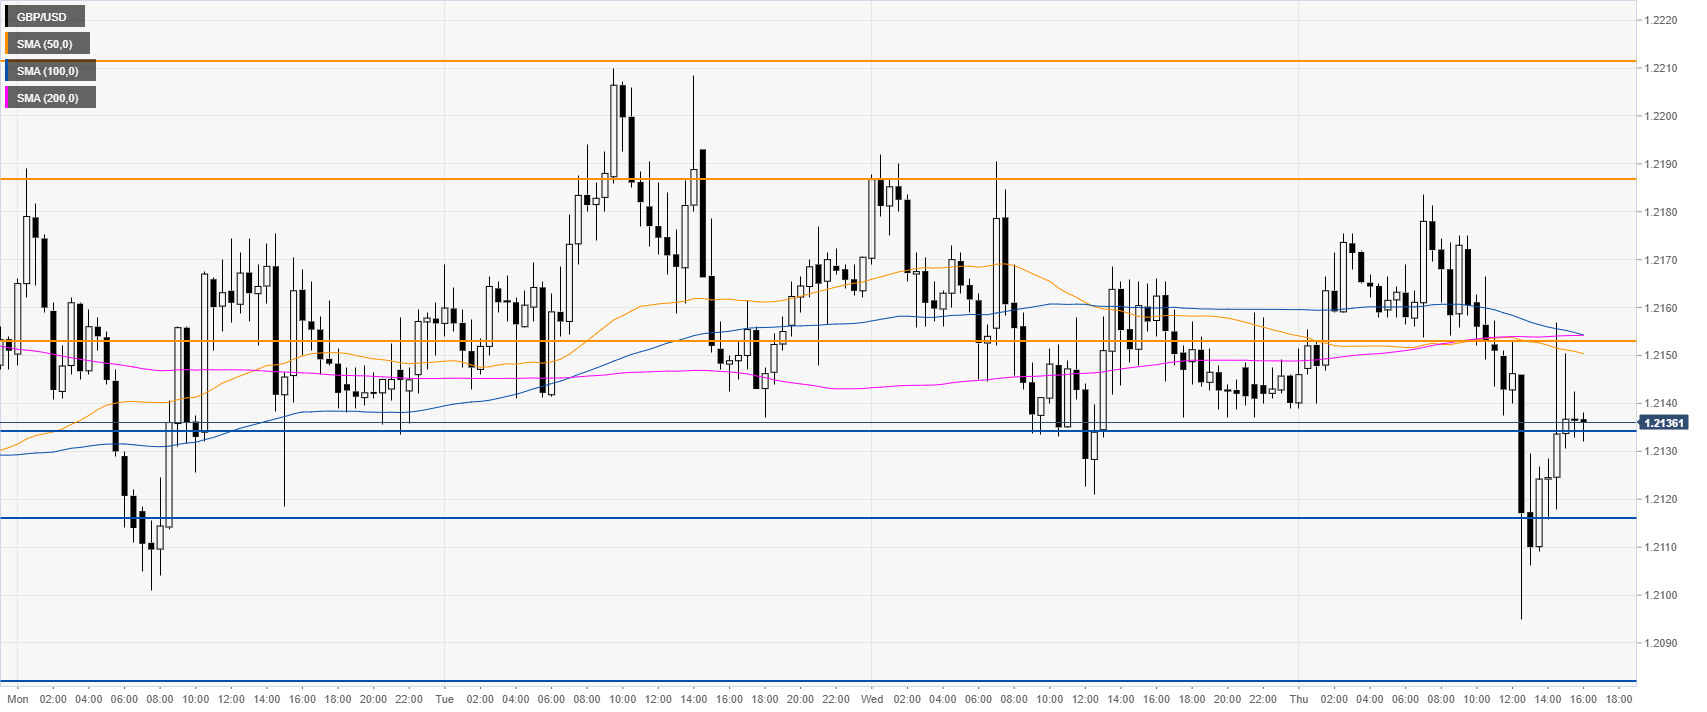
GBP/USD 30-minute chart
Cable is volatile this Thursday as the market had a sharp reaction up from the daily lows. Spot is settling in the 1.2135-1.2154 range as the London session comes to an end. Immediate resistance can be seen near 1.2154, 1.2186 and the 1.2212 levels.
Additional key levels