8 Aug 2019
EUR/USD technical analysis: Fiber sidelined below 1.1253 resistance, following trade war developments
- The US Dollar is gaining some strength as US stock indices are clinging to Wednesday’s gains.
- The level to beat for bears is the 1.1174 critical support.
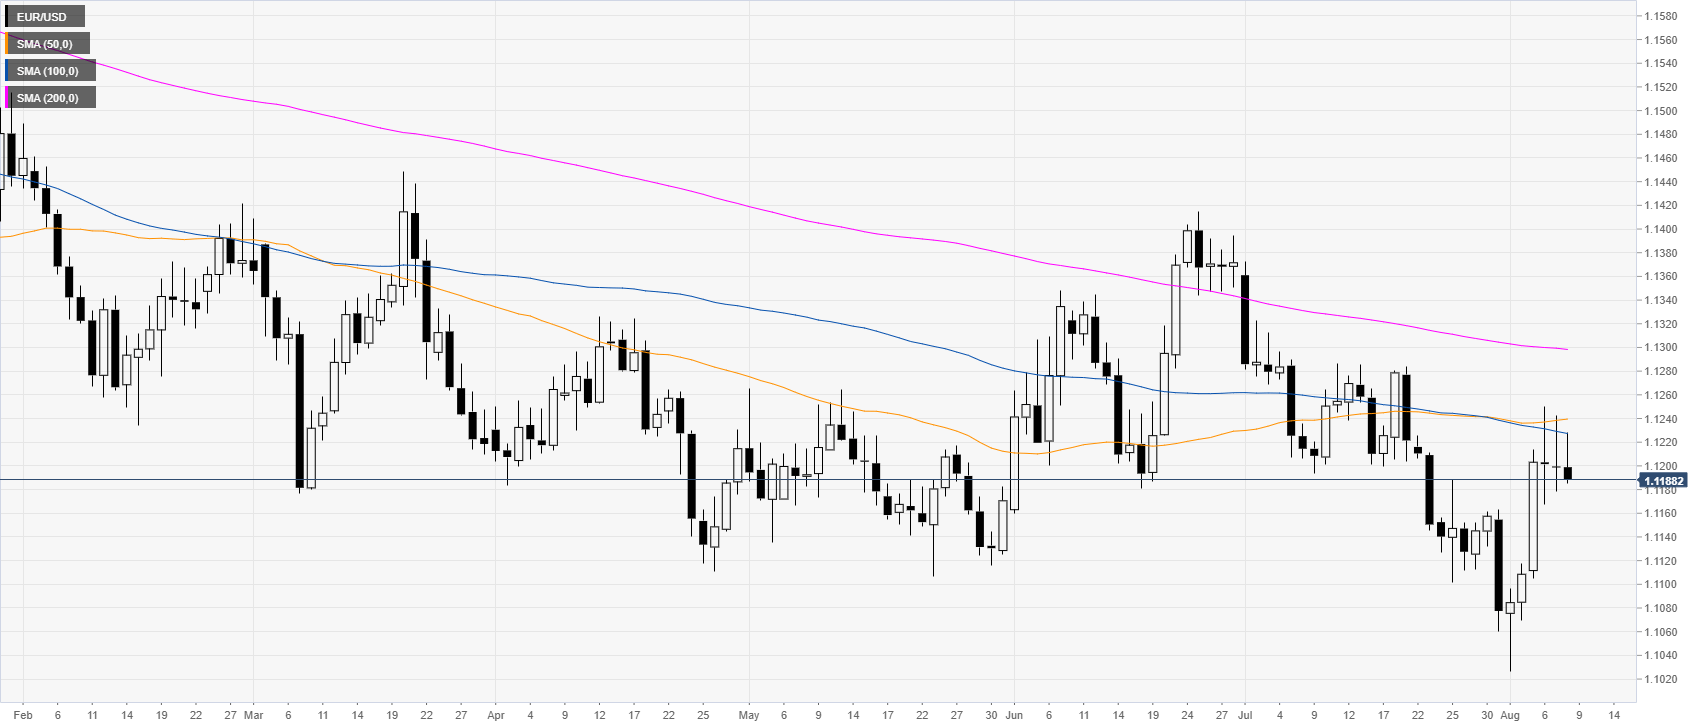
EUR/USD daily chart
EUR/USD is consolidating its recent gains for the third day. It is currently capped by the 1.1253 resistance and the 50/100 -day simple moving averages (DSMAs). The greenback is influenced by the US equity market and trade war developments. US stocks this Thursday are stable hovering near Wednesday’s highs.
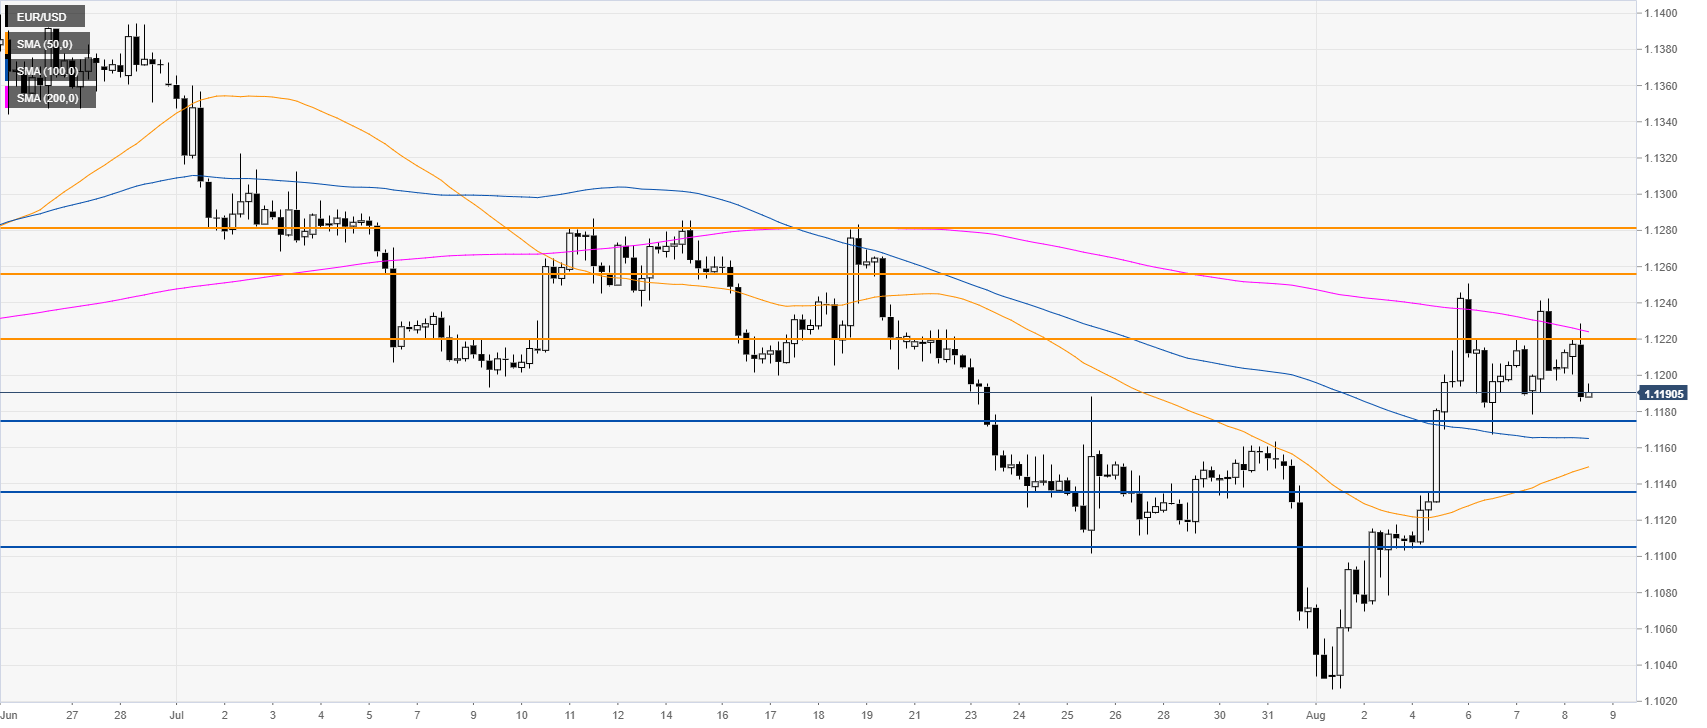
EUR/USD 4-hour chart
EUR/USD is repeatedly rejecting advances above the 1.1220 resistance and the 200 SMA, suggesting weakness in the medium term. Sellers are looking for a clear break below 1.1774 critical support. In such a scenario, Fiber could re-visit 1.1138 and 1.1105 on the way down, according to the Technical Confluences Indicator.
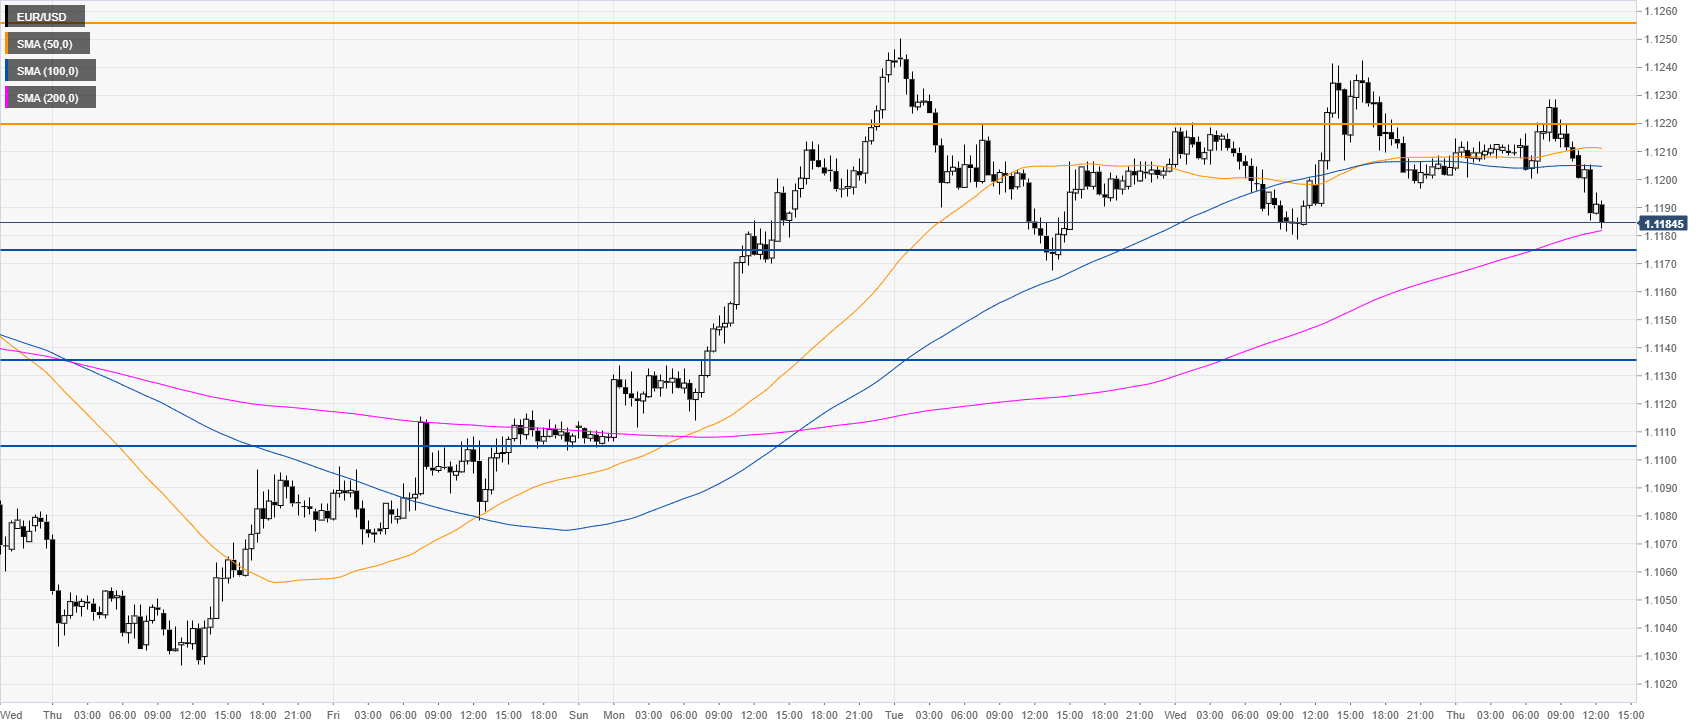
EUR/USD 30-minute chart
The market is trading at daily lows and below the 50 and 100 SMAs suggesting a correction down in the short term. Bulls would need a daily close above 1.1253 to have a chance to resume the bull trend and reach 1.1282 resistance to the upside.
Additional key levels