1 Aug 2019
GBP/USD technical analysis: Cable having a small bounce from daily lows, sub-1.2135 resistance
- GBP/USD is trading off multi-month lows below 1.2135 resistance.
- A break above 1.2135 can see the correction advance towards 1.2167.
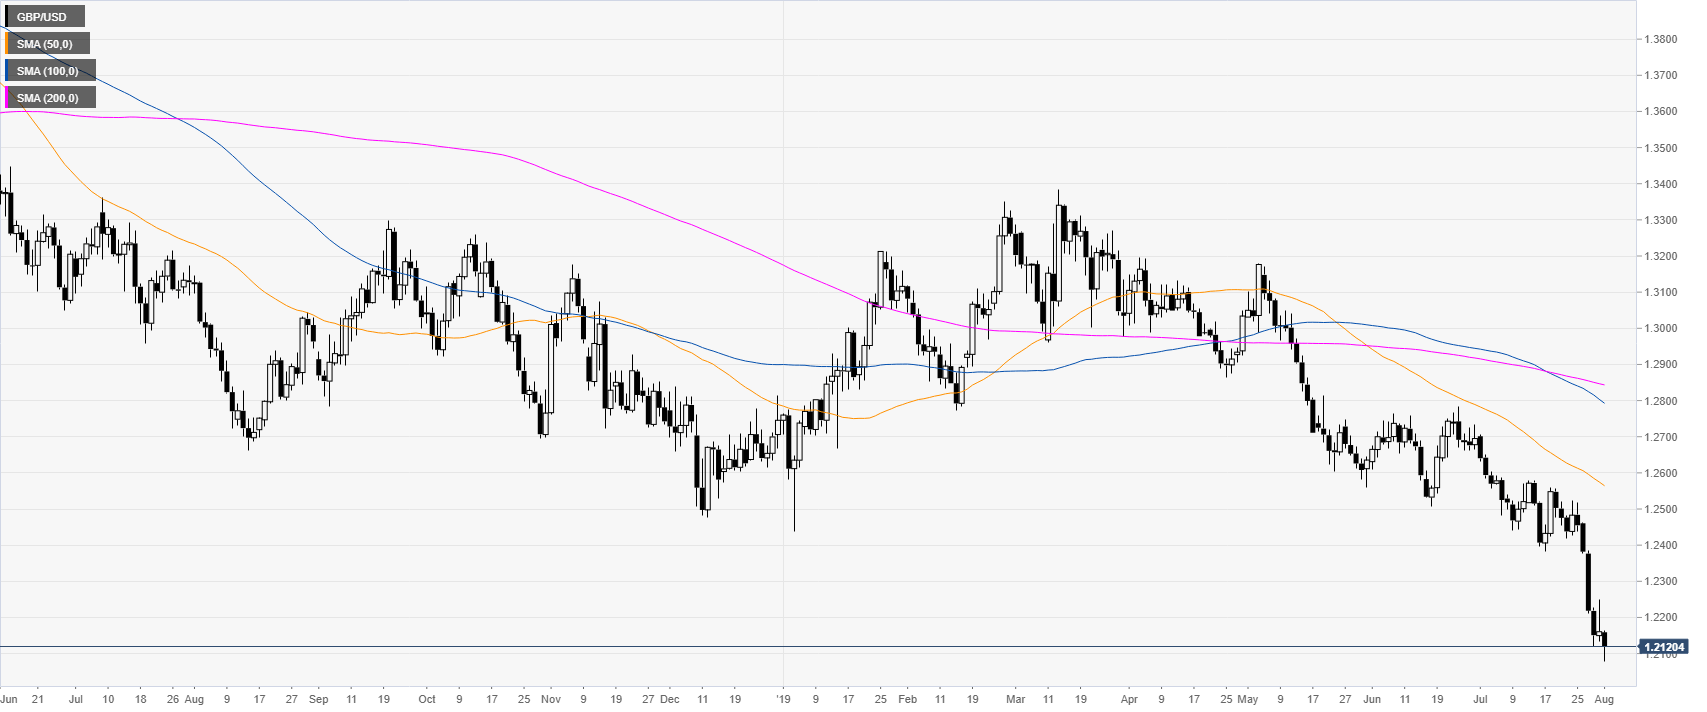
GBP/USD daily chart
GBP/USD is off multi-month lows trading below its main daily simple moving averages.
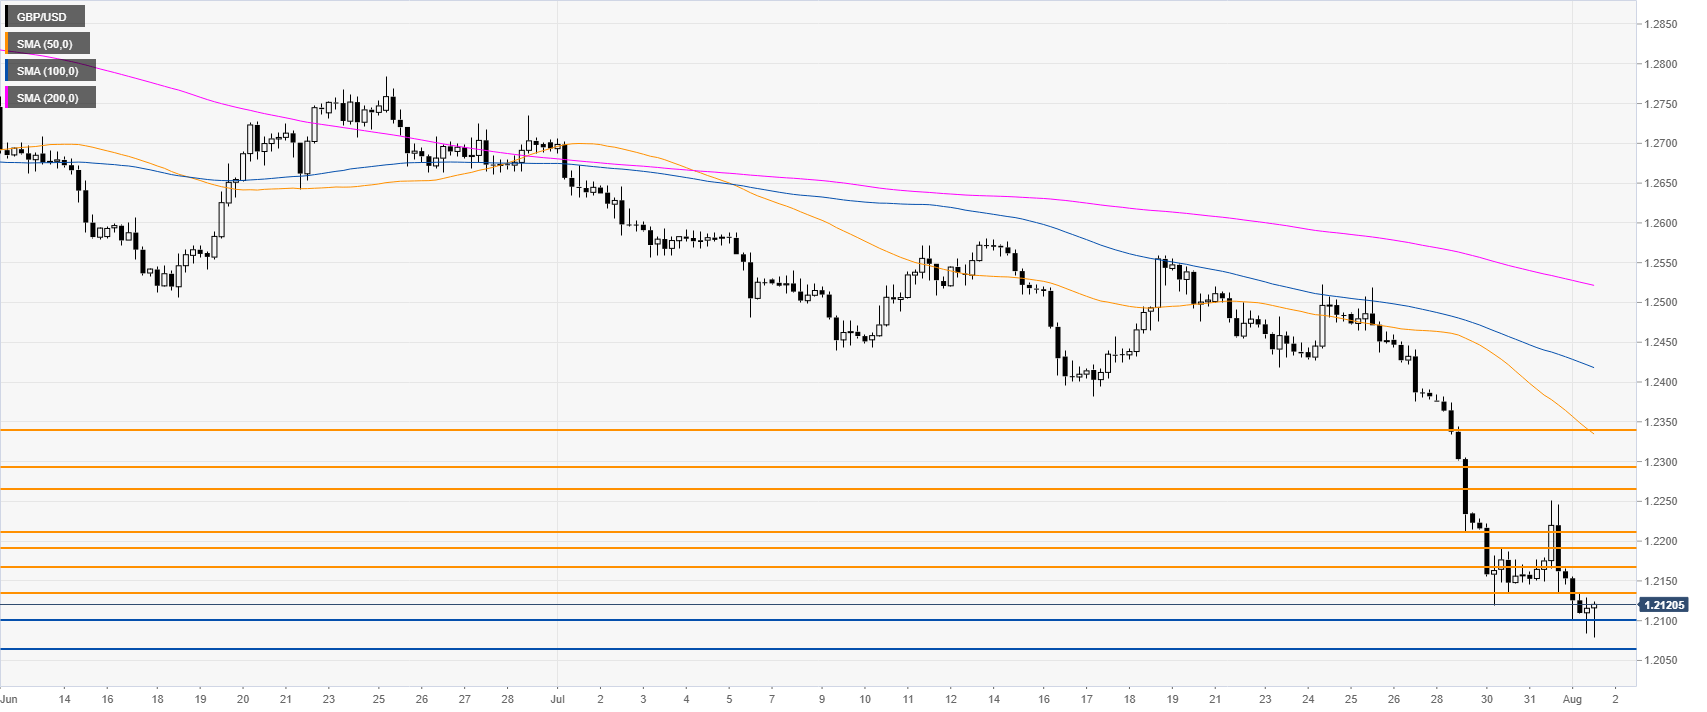
GBP/USD 4-hour chart
GBP/USD is stabilizing just above 1.2100 support. The bears need a break below the level to reach the next supports at 1.2067 and 1.1998, according to the Technical Confluences Indicator.
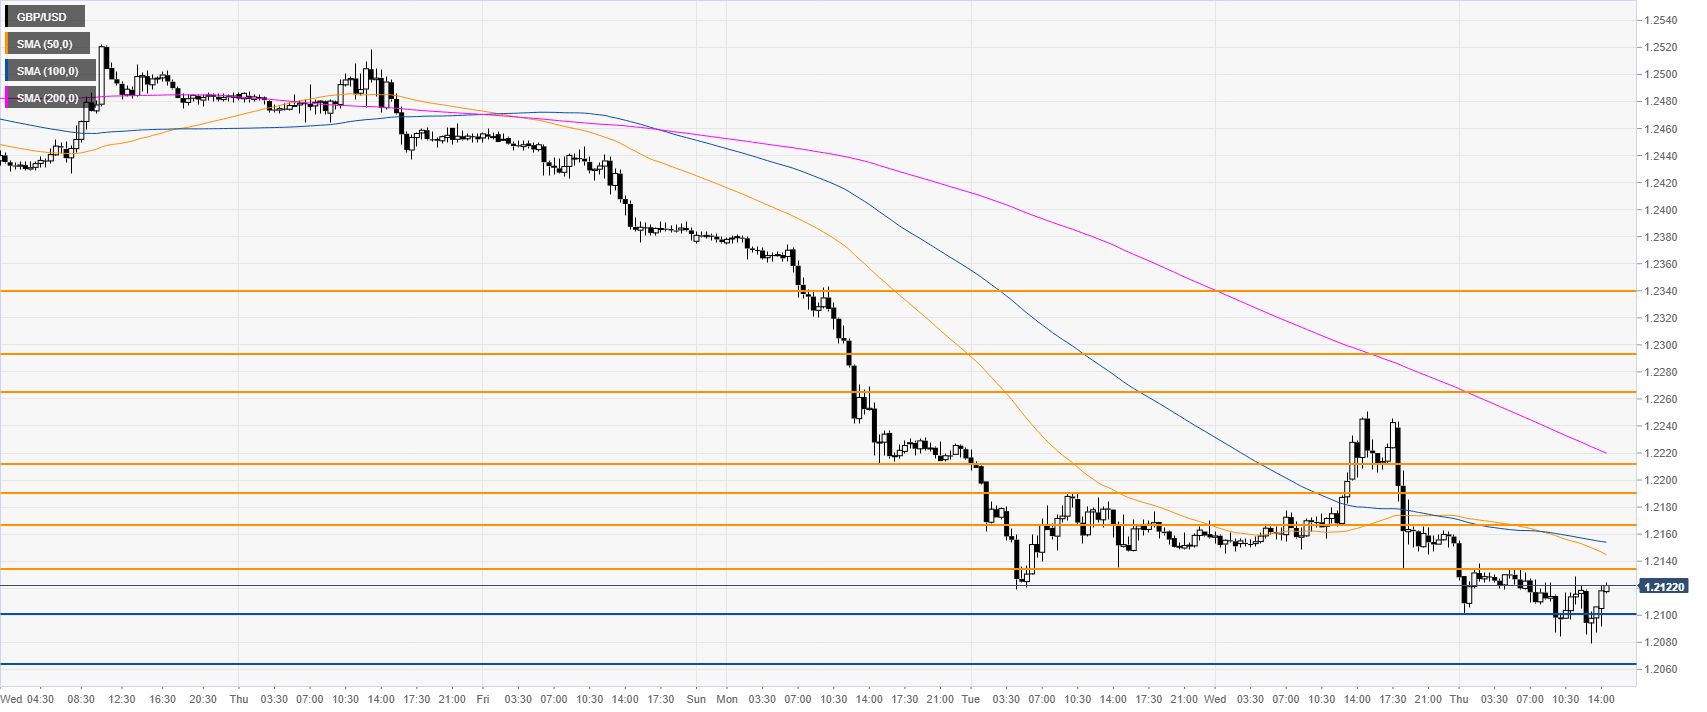
GBP/USD 30-minute chart
Cable is having a small bounce from the daily lows. The bulls need to break 1.2135 to extend the correction towards 1.2167, according to the Technical Confluences Indicator.
Additional key levels