17 Jul 2019
GBP/USD technical analysis: Cable consolidating losses just below 1.2414 resistance
- GBP/USD is under bearish pressure near 27-month lows.
- Support can be seen near 1.2390 and 1.2340 according to the Technical Confluences Indicator.
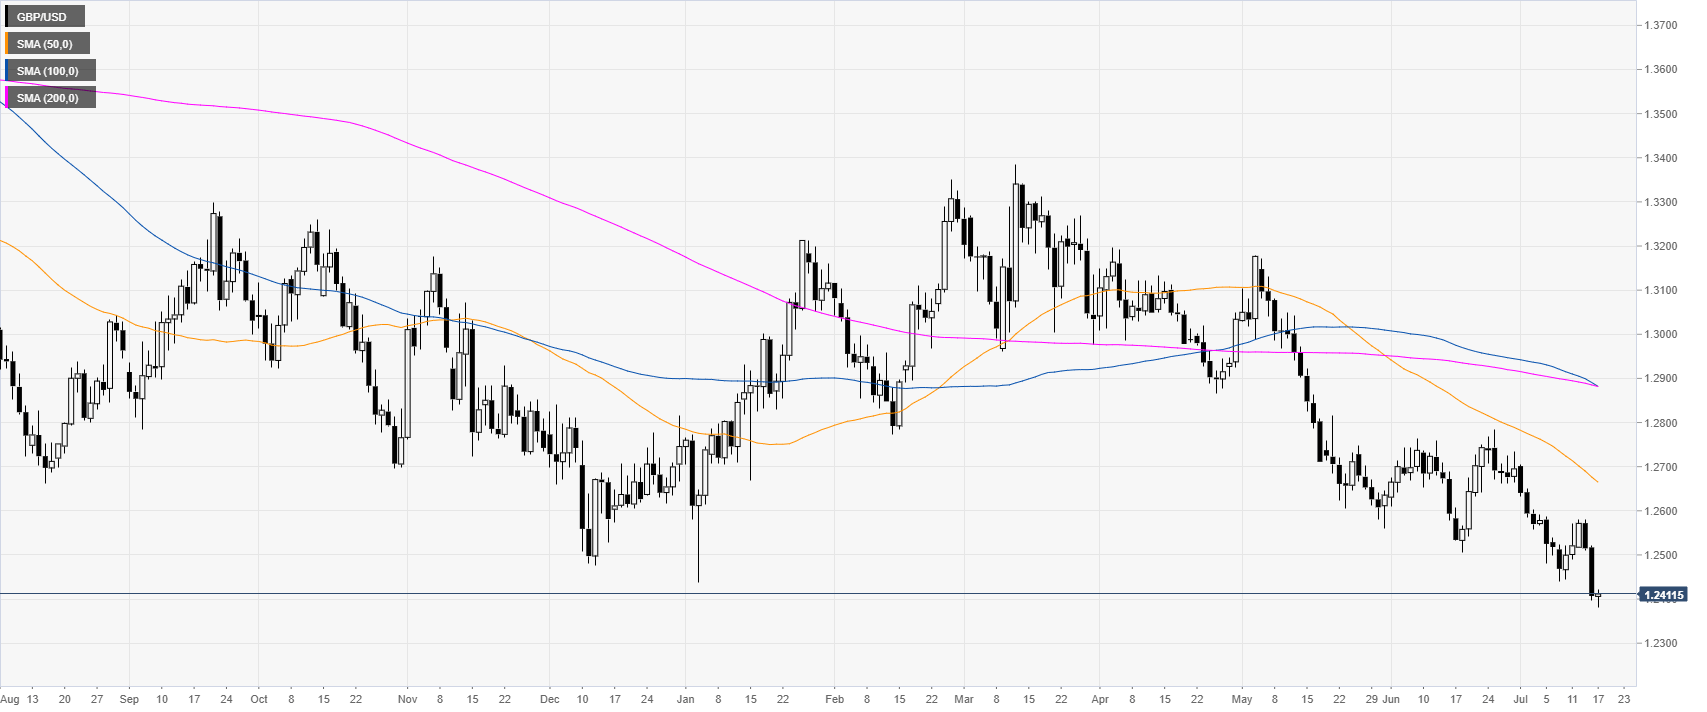
GBP/USD daily chart
GBP/USD is trading at 27-month lows as the bears are challenging the 1.2400 figure. Earlier in London, the UK Indflation in June came in as expected by analysts at 2% (year-on-year) with a limited reaction on the GBP.
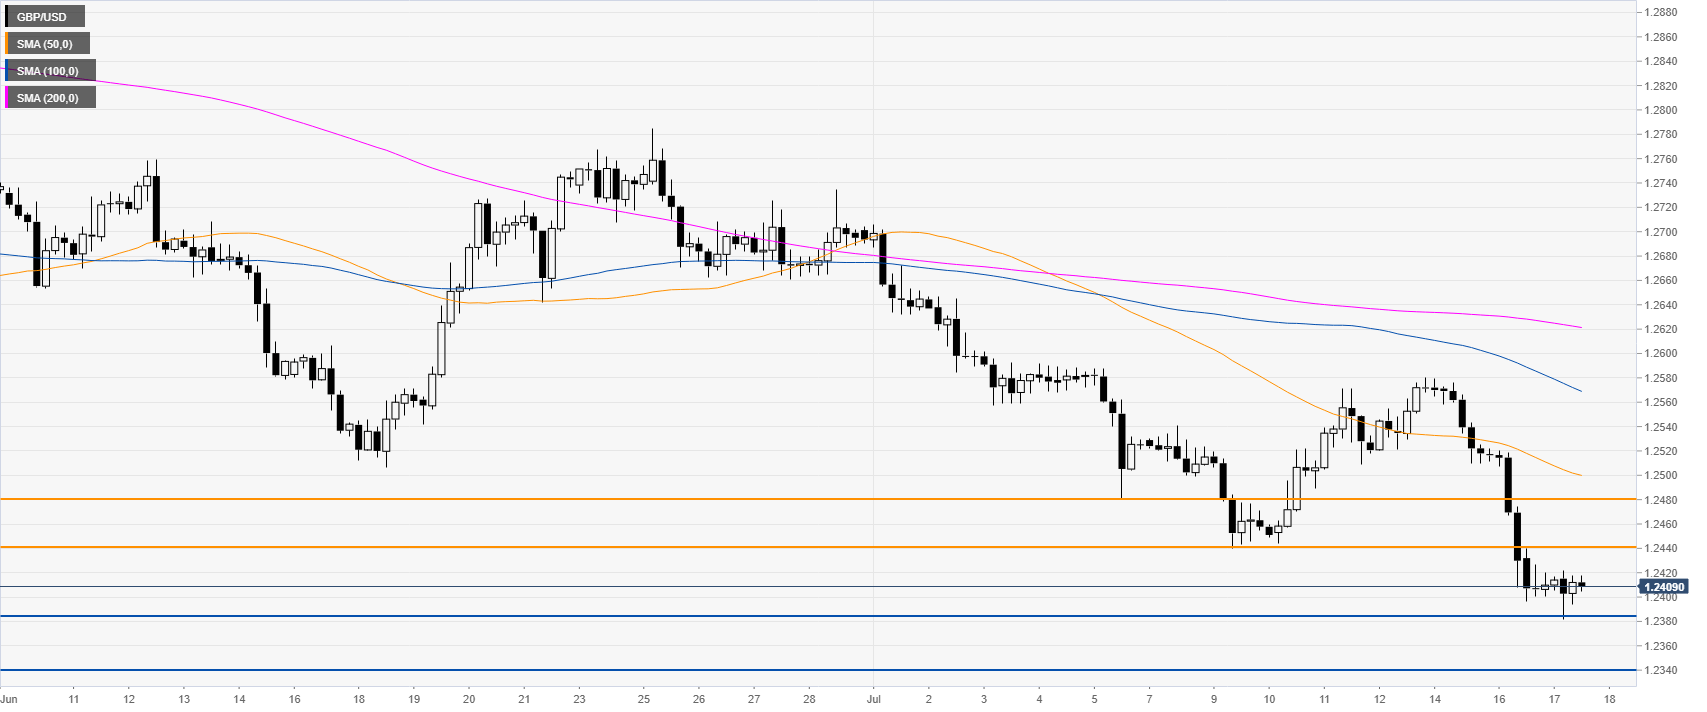
GBP/USD 4-hour chart
Cable remains under selling pressure below 1.2440 and the main simple moving averages (SMAs). Bears likely intend to targets 1.2390 and 1.2340 levels to the downside, according to the Technical Confluences Indicator.
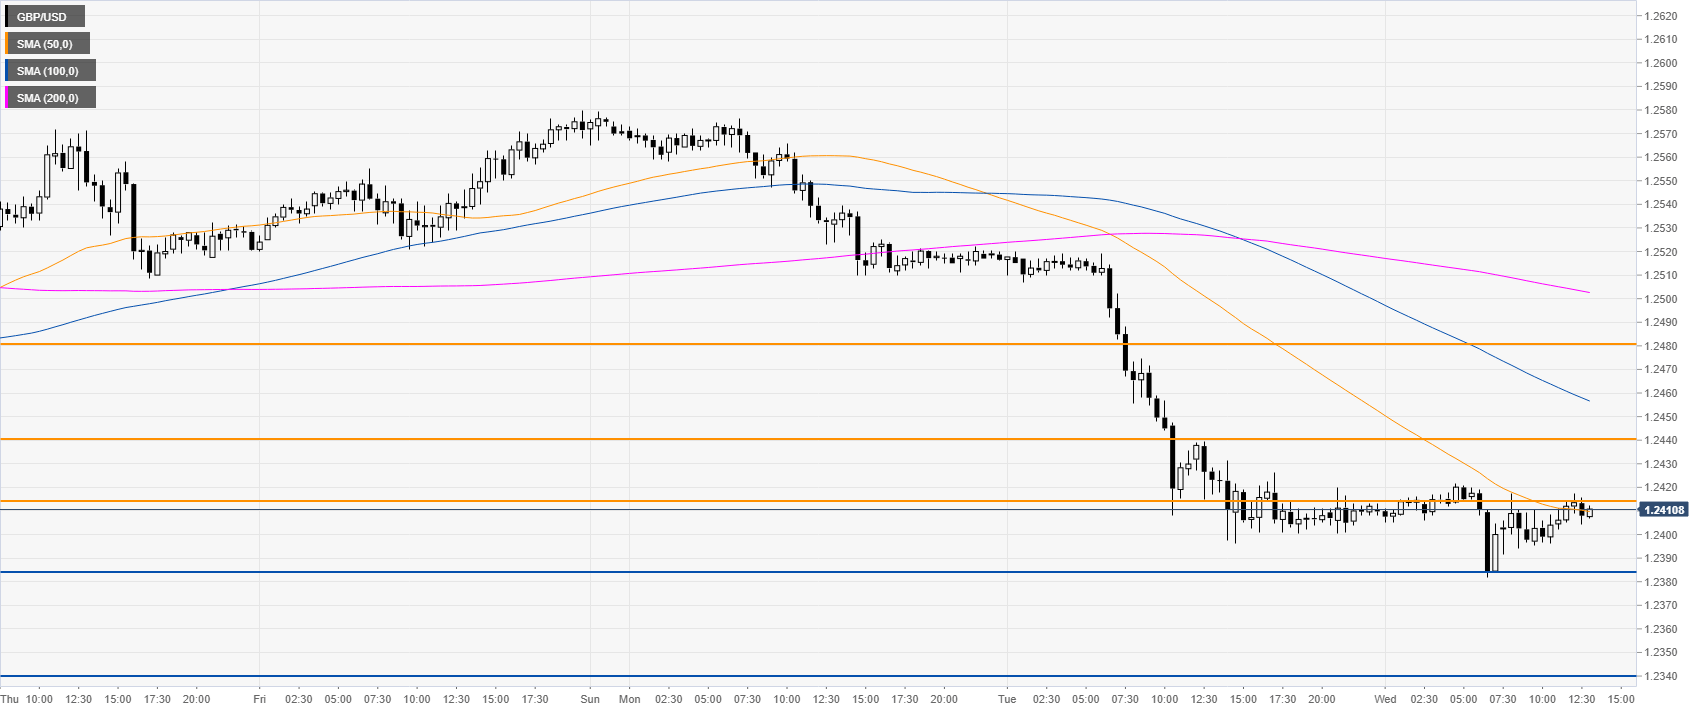
GBP/USD 30-minute chart
GBP/USD is challenging the 1.2414 resistance and the 50 SMA. The market remain under pressure however a corrective pullback above 1.2414 can lead to 1.2440 and 1.2480, according to the Technical Confluences Indicator.
Additional key levels