15 Jul 2019
AUD/USD technical analysis: Aussie challenging the daily highs near 0.7040
- AUD/USD is trying to break above its daily high near 0.7040.
- The level to beat for bulls is 0.7060 and 0.7100 on the way up.
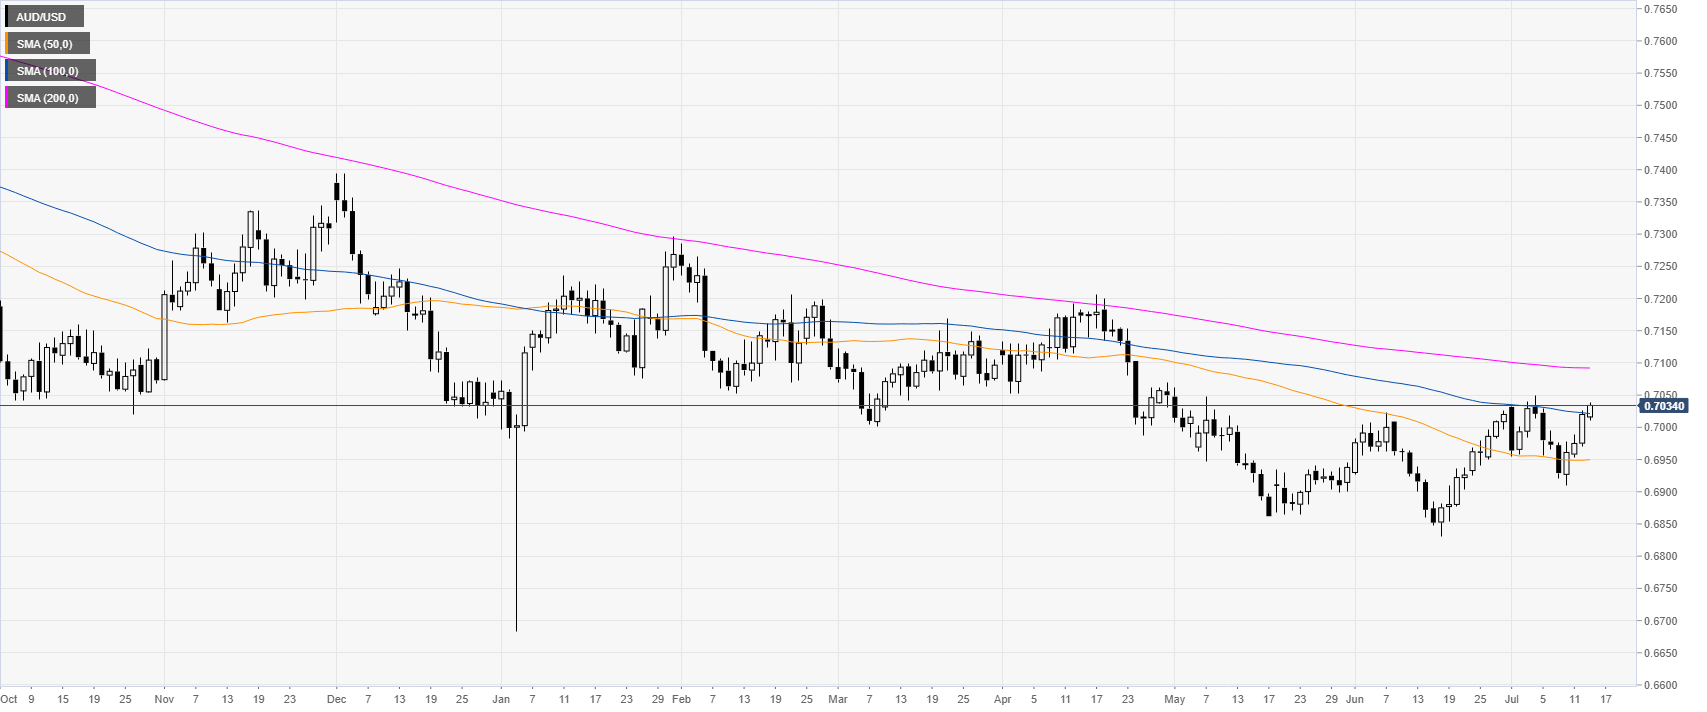
AUD/USD daily chart
The Aussie is in a bear trend below its 200-day simple moving averages (DSMAs).
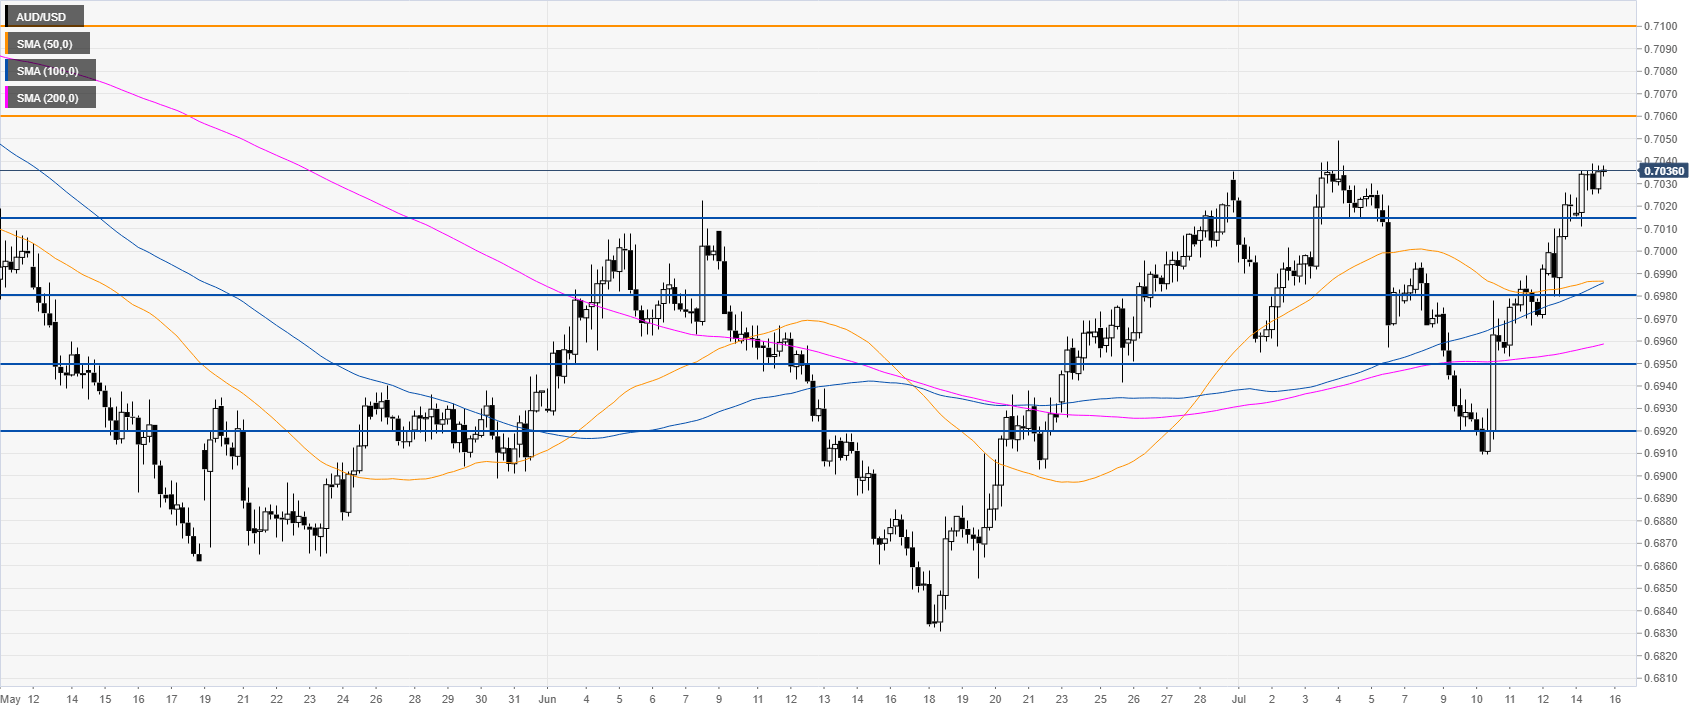
AUD/USD 4-hour chart
AUD/USD is trading above its main SMAs suggesting bullish momentum in the near term. The level to beat for bulls is at 0.7060 followed by 0.7100, according to the Technical Confluences Indicator.
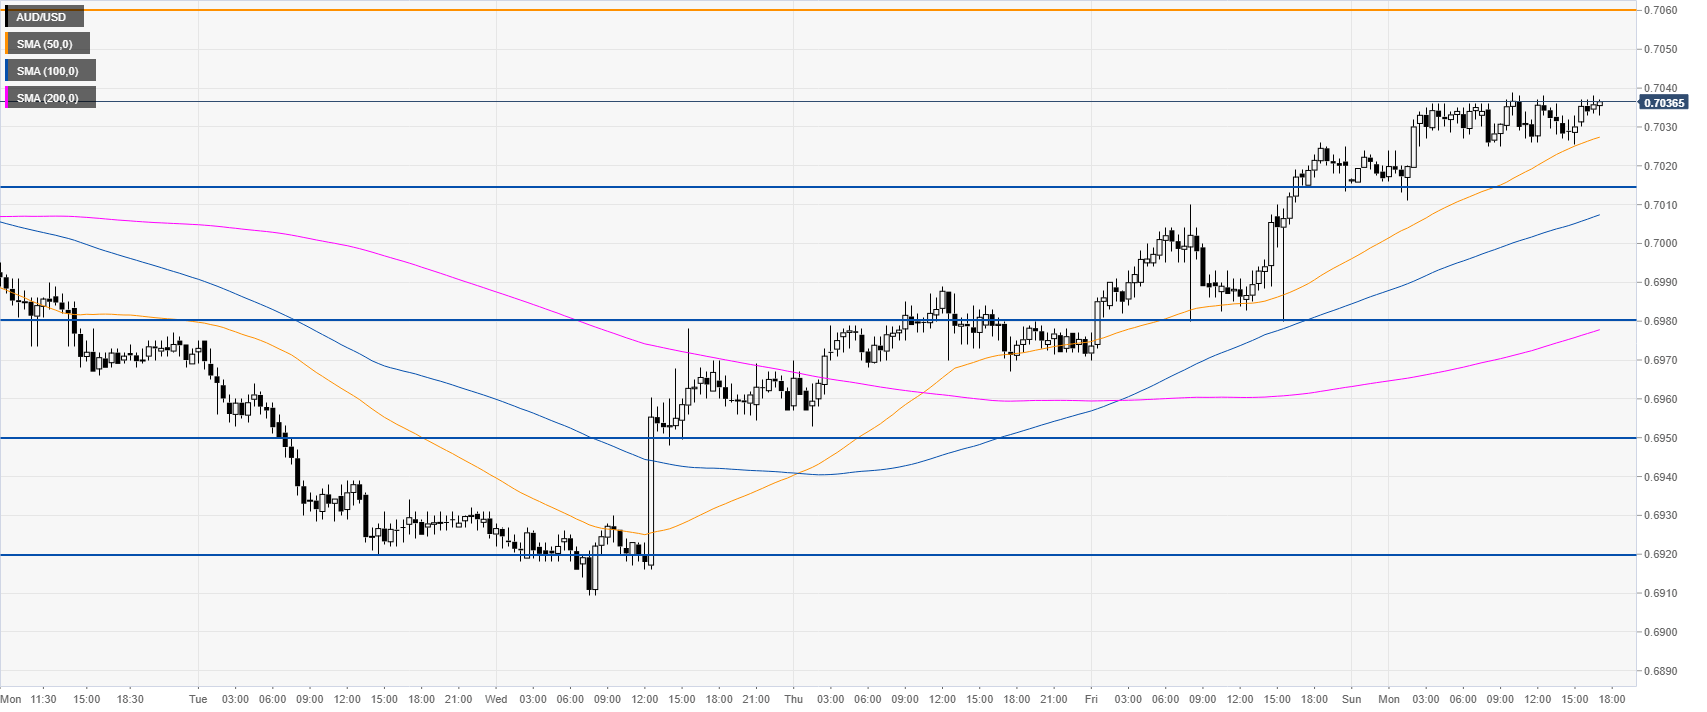
AUD/USD 30-minute chart
AUD/USD is advancing above the main SMAs suggesting bullish momentum in the near term. Support is seen at 0.7015 and 0.6980, according to the Technical Confluences Indicator.