27 Jun 2019
S&P500 technical analysis: US stocks drop to 5-day lows sub-2,940.00
- The S&P500 is pulling back down after hitting a new all-time time.
- The market can continue to drop towards 2,880.00 and 2,960.00 support.
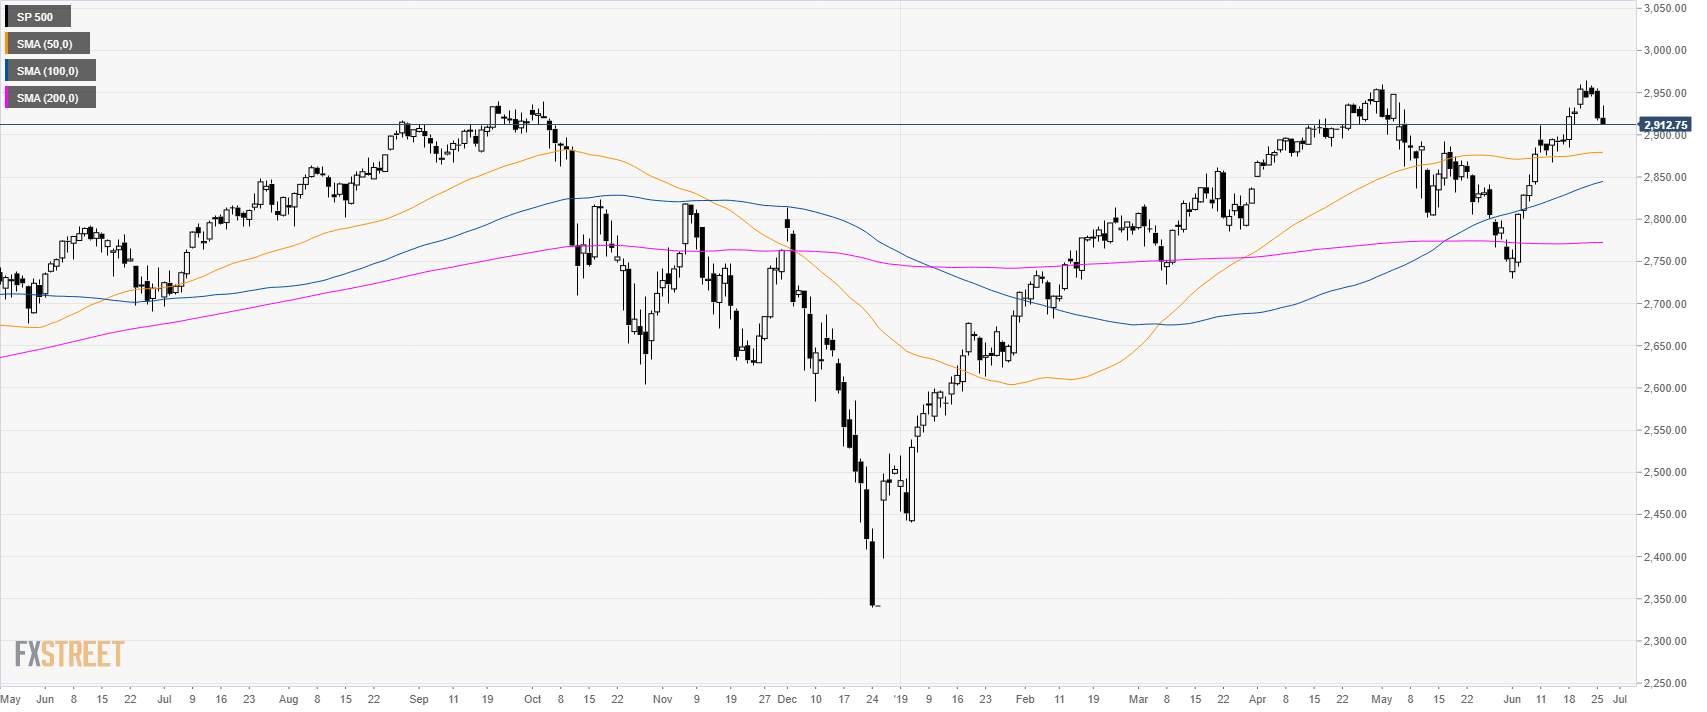
S&P500 daily chart
Last week, the S&P500 found resistance below 2,965.00 new all-time high. The market is retracing and trading at 5-day lows.
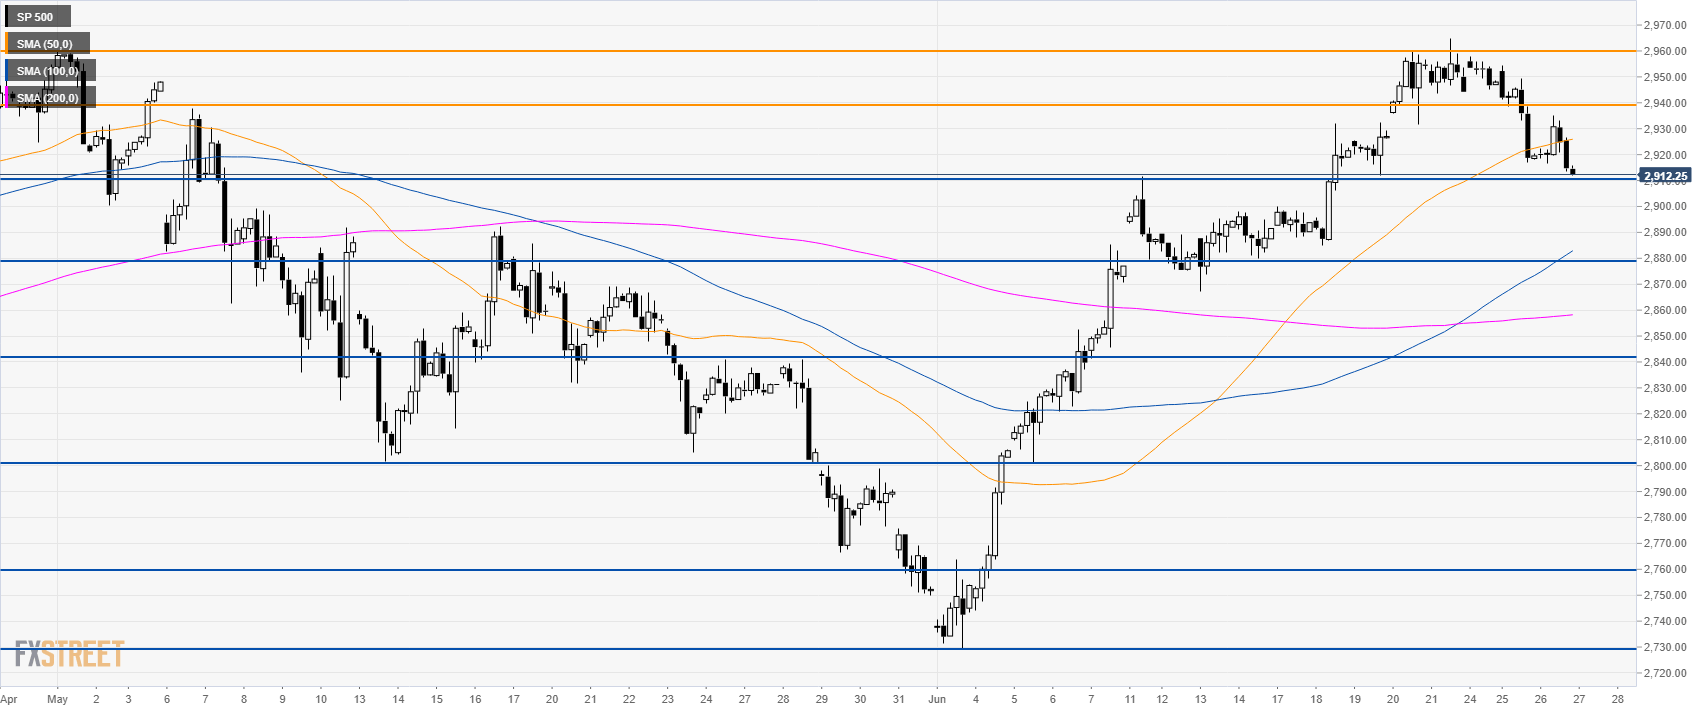
S&P500 4-hour chart
The stock index is trading below its 50 SMA suggesting a correction down. The S&P500 is about to test the 2,910.00 support. If broken to the downside, the bears can reach 2,880.00 and 2,840.00 on the way down. Resistance is at the 2,940.00 and 2,960.00 levels.
Additional key levels