26 Jun 2019
US Dollar Index technical analysis: DXY regaining some poise - Bulls not out of the woods
- The US Dollar Index (DXY) bull trend is at risk as the market broke below key levels.
- Resistance is seen at the 96.46 and 96.74 levels.
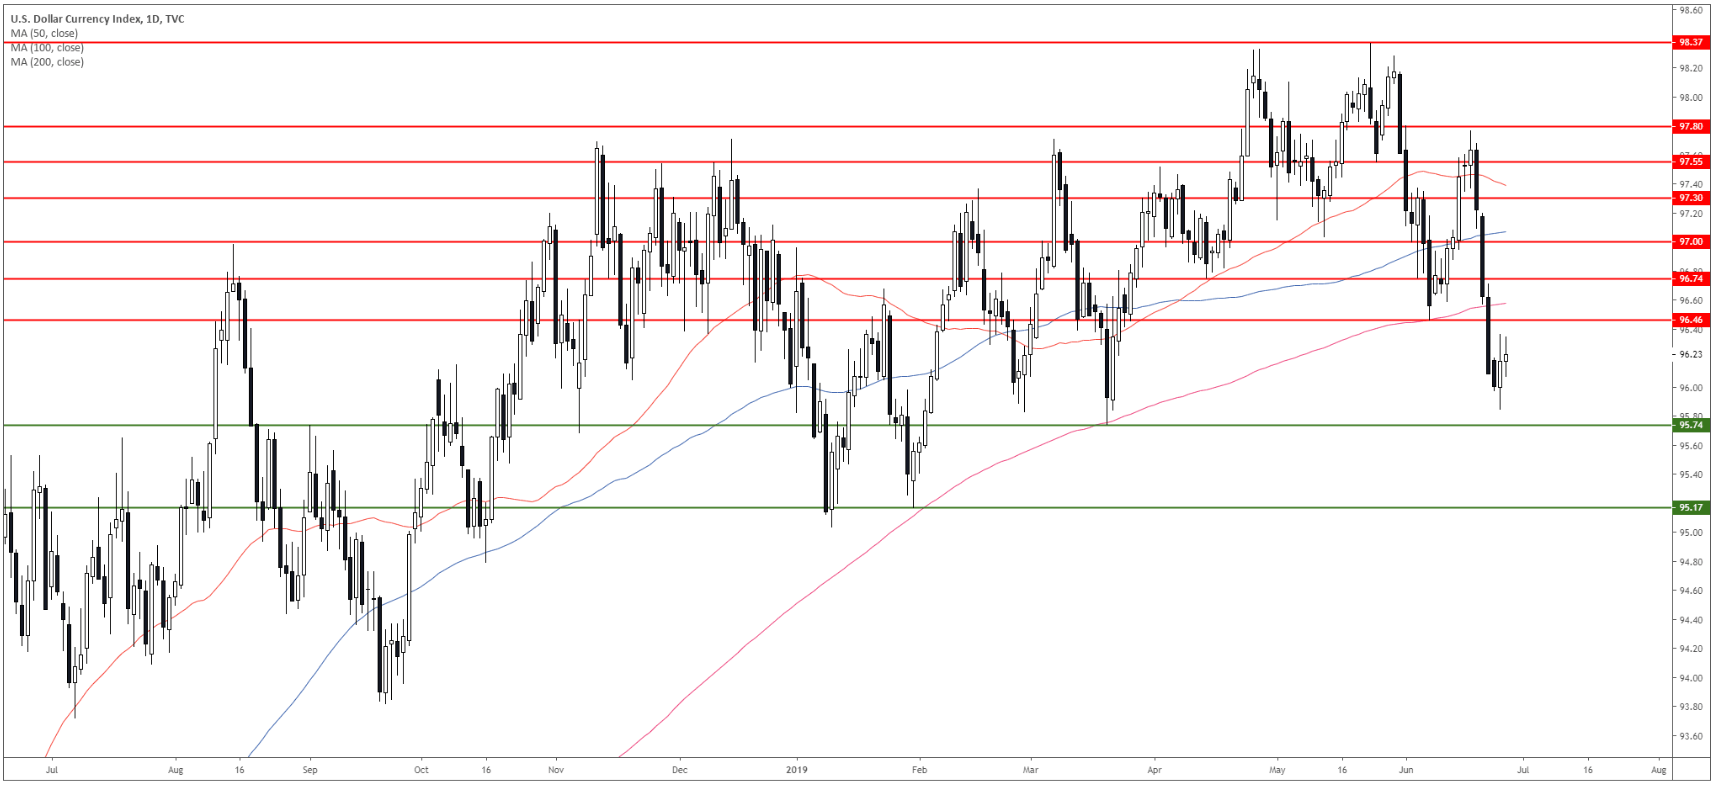
DXY daily chart
The US Dollar Index (DXY) fell below 96.46 key support and the 200-day simple moving average (DSMA) suggesting that the bull trend might be at risk.
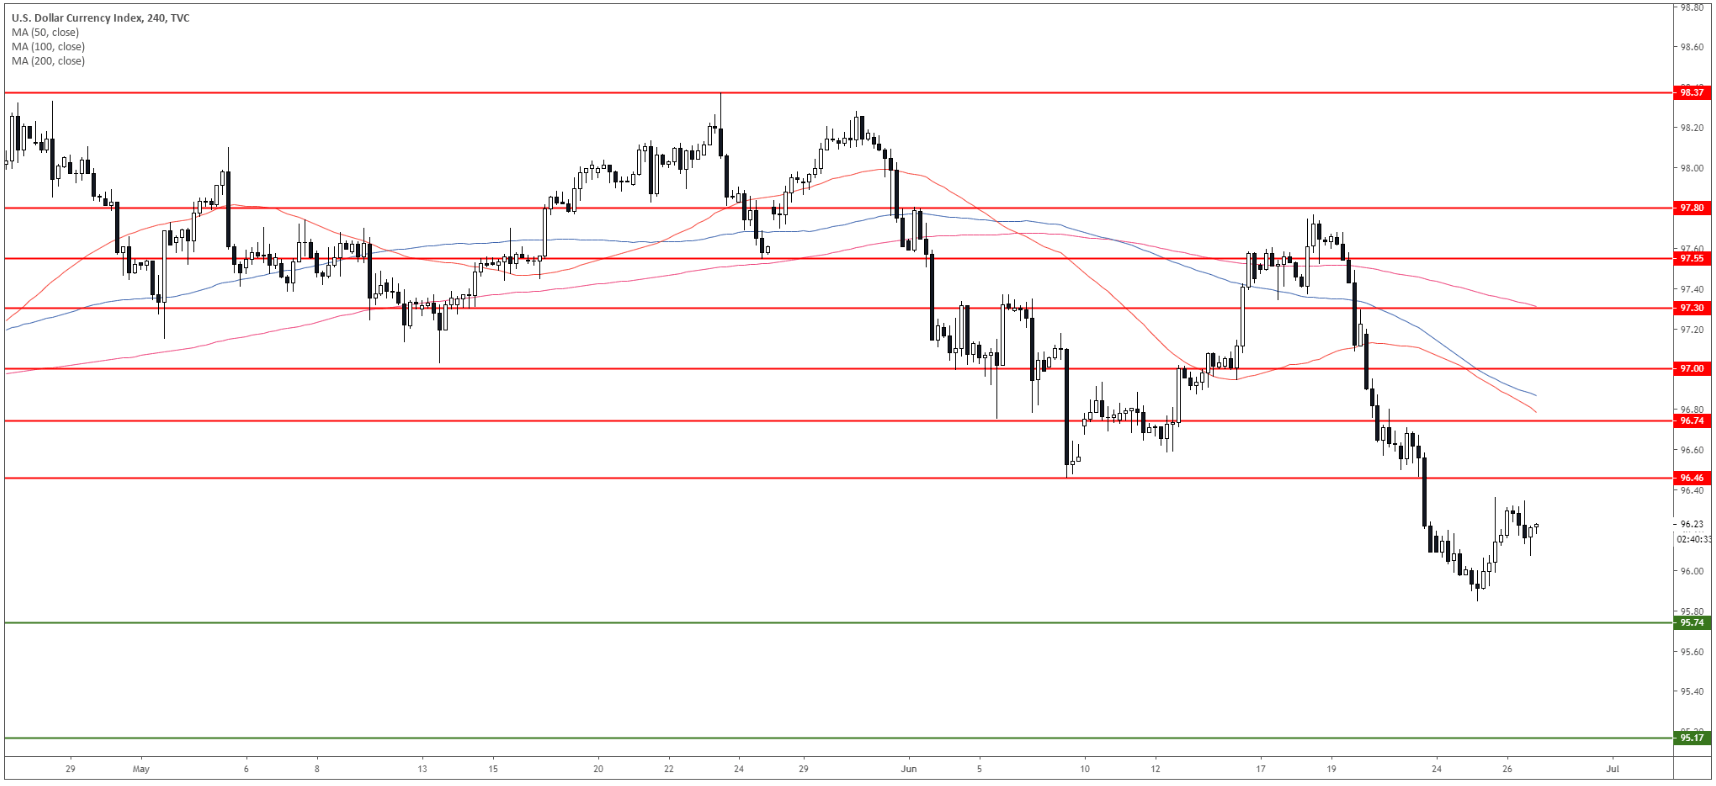
DXY 4-hour chart
DXY is under pressure below its main SMAs suggesting bearish momentum in the near term. Bears want to reach to 95.74 and 95.17 on the way down. Immediate resistance is at 96.46 and 96.74.
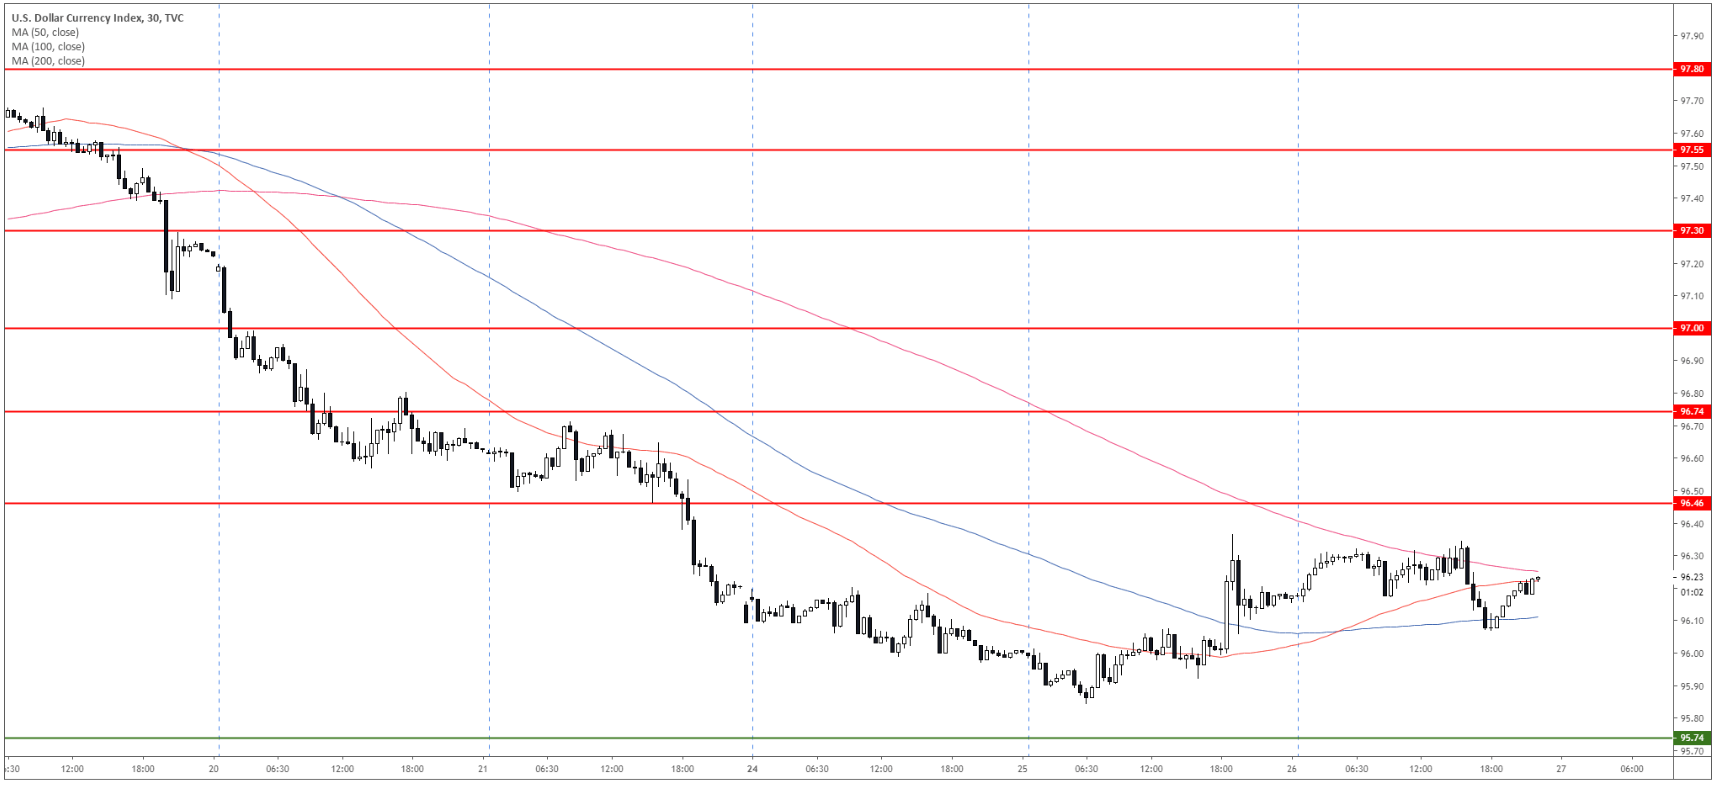
DXY 30-minute chart
The market is correcting up as the 50 SMA is crossing above the 100 SMA. However, DXY remains under pressure below the 96.46 resistance.
Additional key levels