19 Jun 2019
US Dollar Index Technical Analysis: Further upside could extend to the 98.00 mark and beyond
- The up move in DXY has reached and surpassed March peaks in the 97.70 region, where it is now looking to stabilize.
- The FOMC meeting will be key in determining the price action in the very near term. That said, immediately to the upside emerges the 98.00 neighbourhood ahead of 2019 peaks in the 98.35/40 band.
- On the downside, the 21-day/55-day SMAs in the 95.40/45 region should offer initial contention along with weekly lows in the 97.30 region. Further south aligns the 97.13/05 zone, coincident with the 10-day and 100-day SMAs.
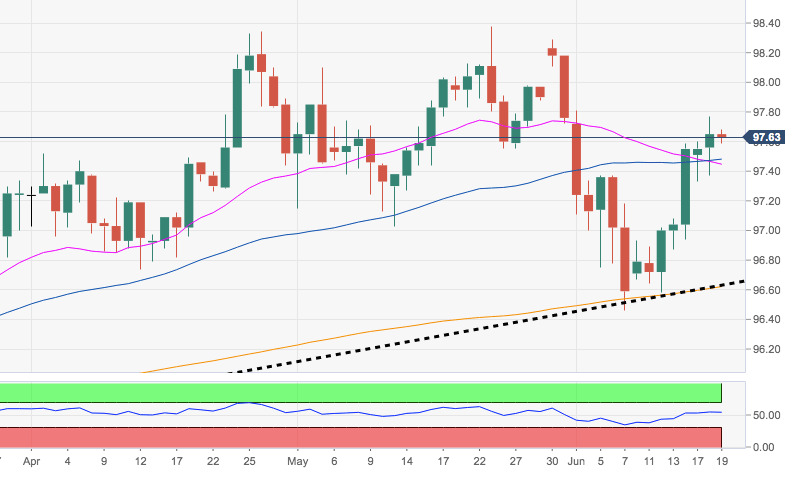
- Looking at the broader picture, the 200-day SMA and the multi-month support line in the mid-96.00s should hold the downside and keep the constructive bias unchanged for the time being.
DXY daily chart