13 Jun 2019
US Dollar Index technical analysis: DXY climbs above 97.00
- DXY is grinding above the 97.00 handle.
- Targets to the upside can be seen at 97.30 and 97.55.
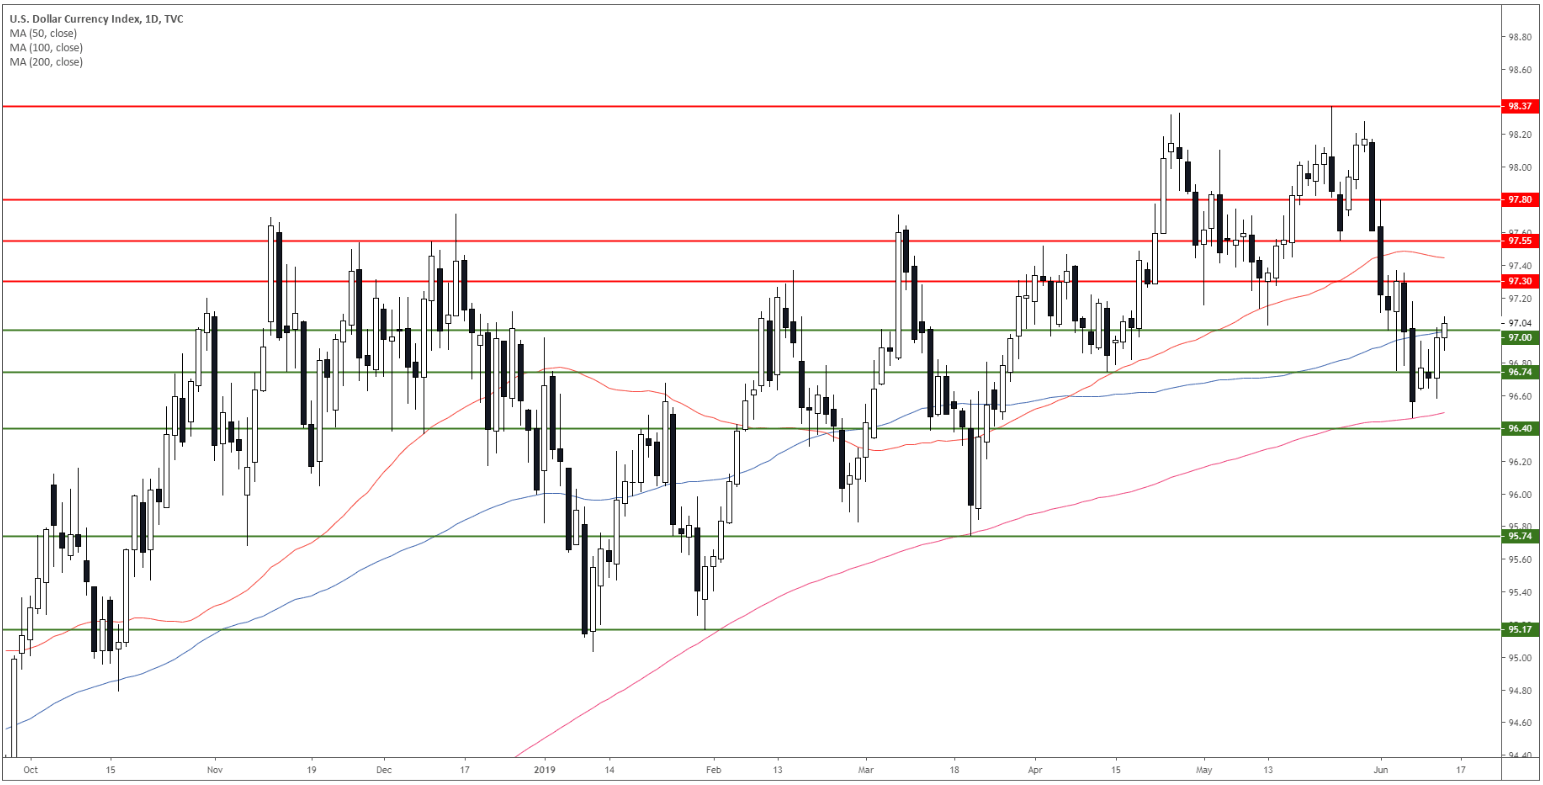
DXY daily chart
The US Dollar Index (DXY) is in a bull trend above the 97.00 level and the 100/ 200-day simple moving averages (DSMA).
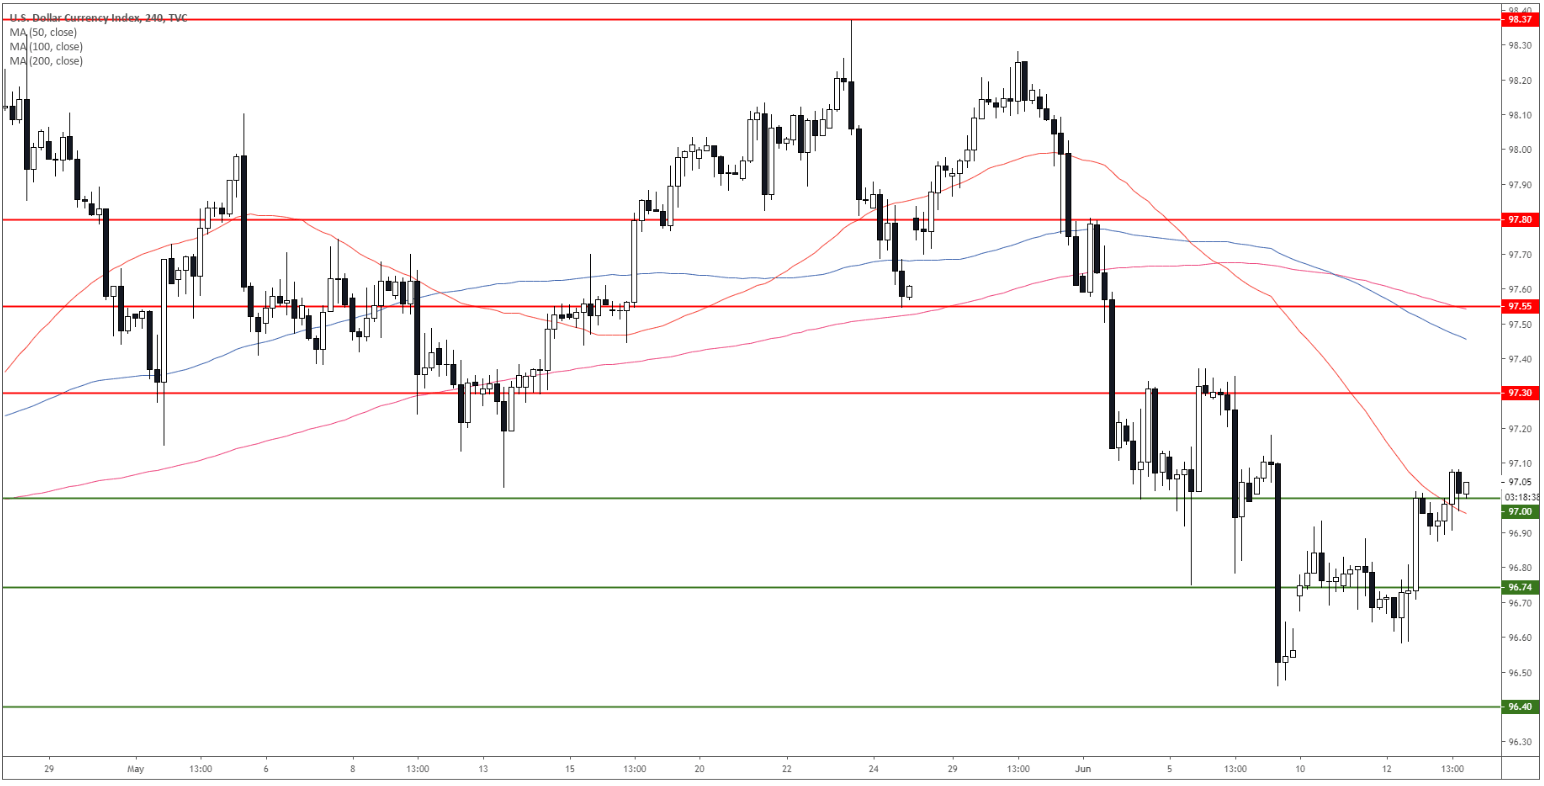
DXY 4-hour chart
DXY is trading above the 50 SMA.
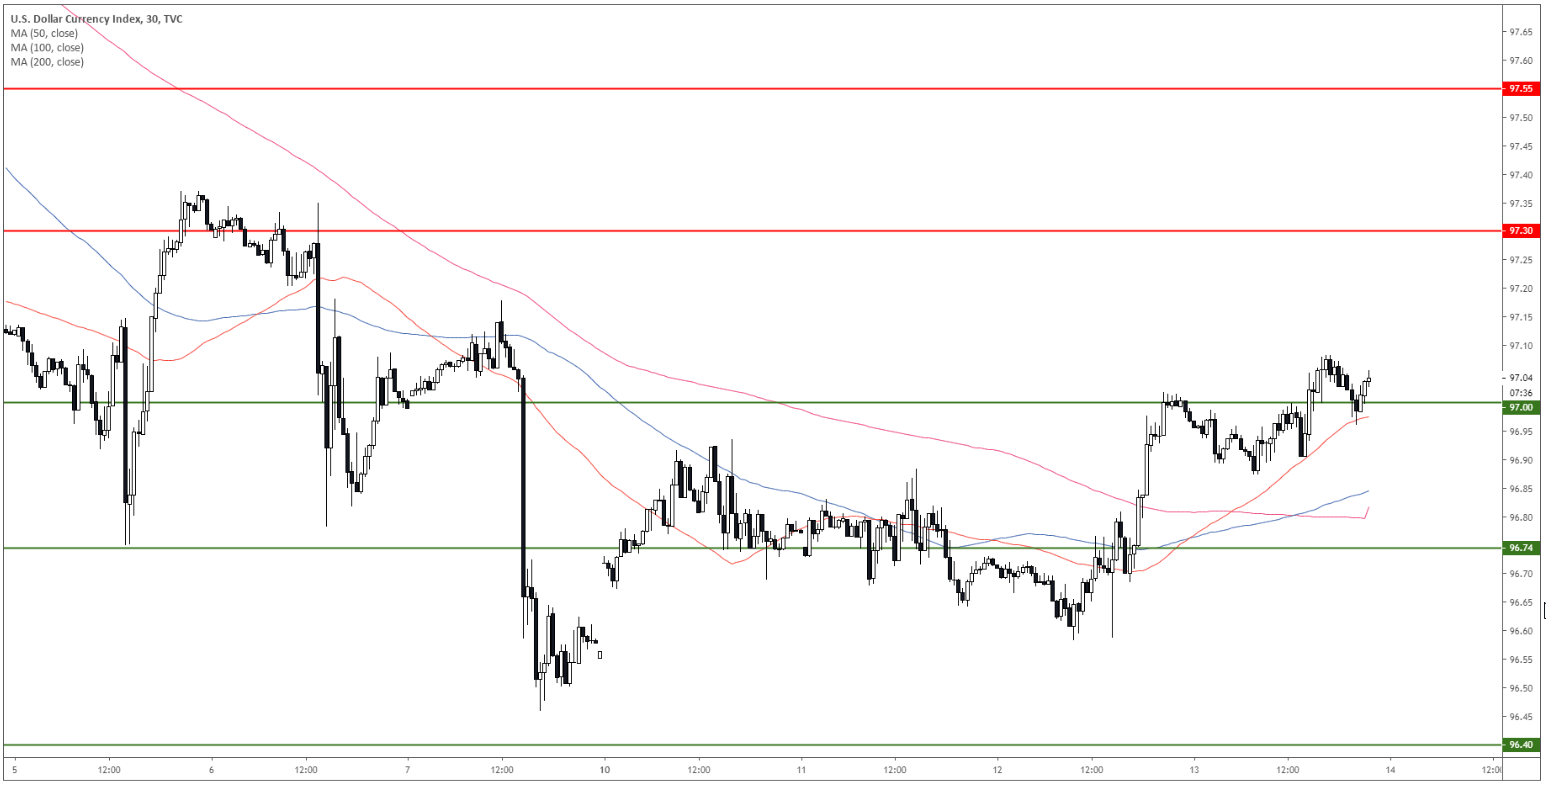
DXY 30-minute chart
DXY is trading above its main SMAs suggesting bullish momentum in the near term. Bulls want a continuation to 97.30 and 97.55 resistances. Support is at 97.00 and 96.74.
Additional key levels