22 May 2019
S&P500 technical analysis: Wall Street in green as Google-Huwaei tensions de-escalate a notch
- The U.S. Commerce Department announced a 90-day license for mobile phone companies and internet providers to work with Huawei to keep the existing networks online and to protect current users from security risks.
- Google can send software updates to Huawei phones with Android operating system until August 19.
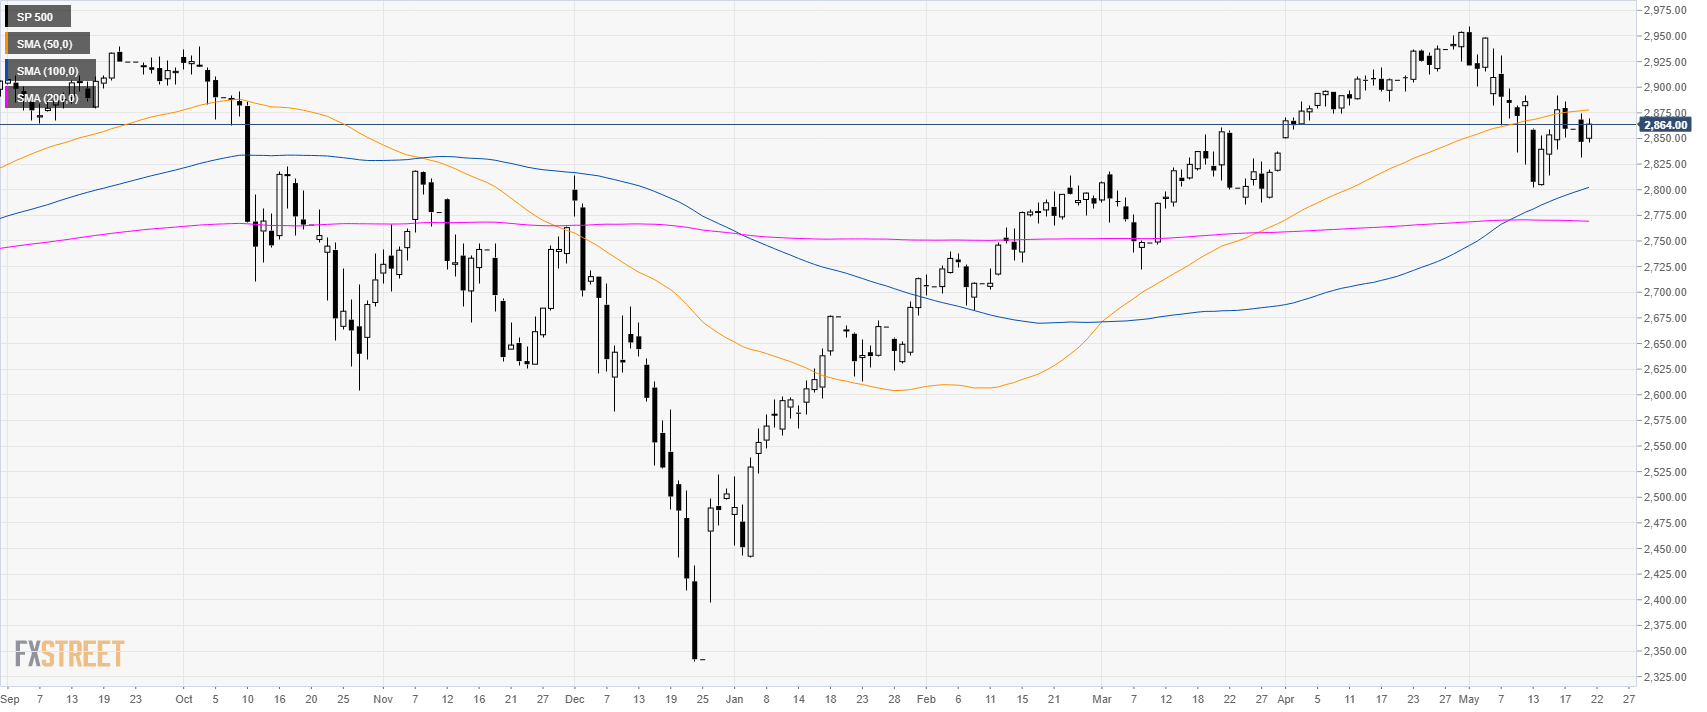
S&P500 daily chart
The S&P500 Index is trading in a bull trend above its 100 and 200-period simple moving averages (SMAs). The index is up as investors as the tensions between Google and Huawei are slightly easing.
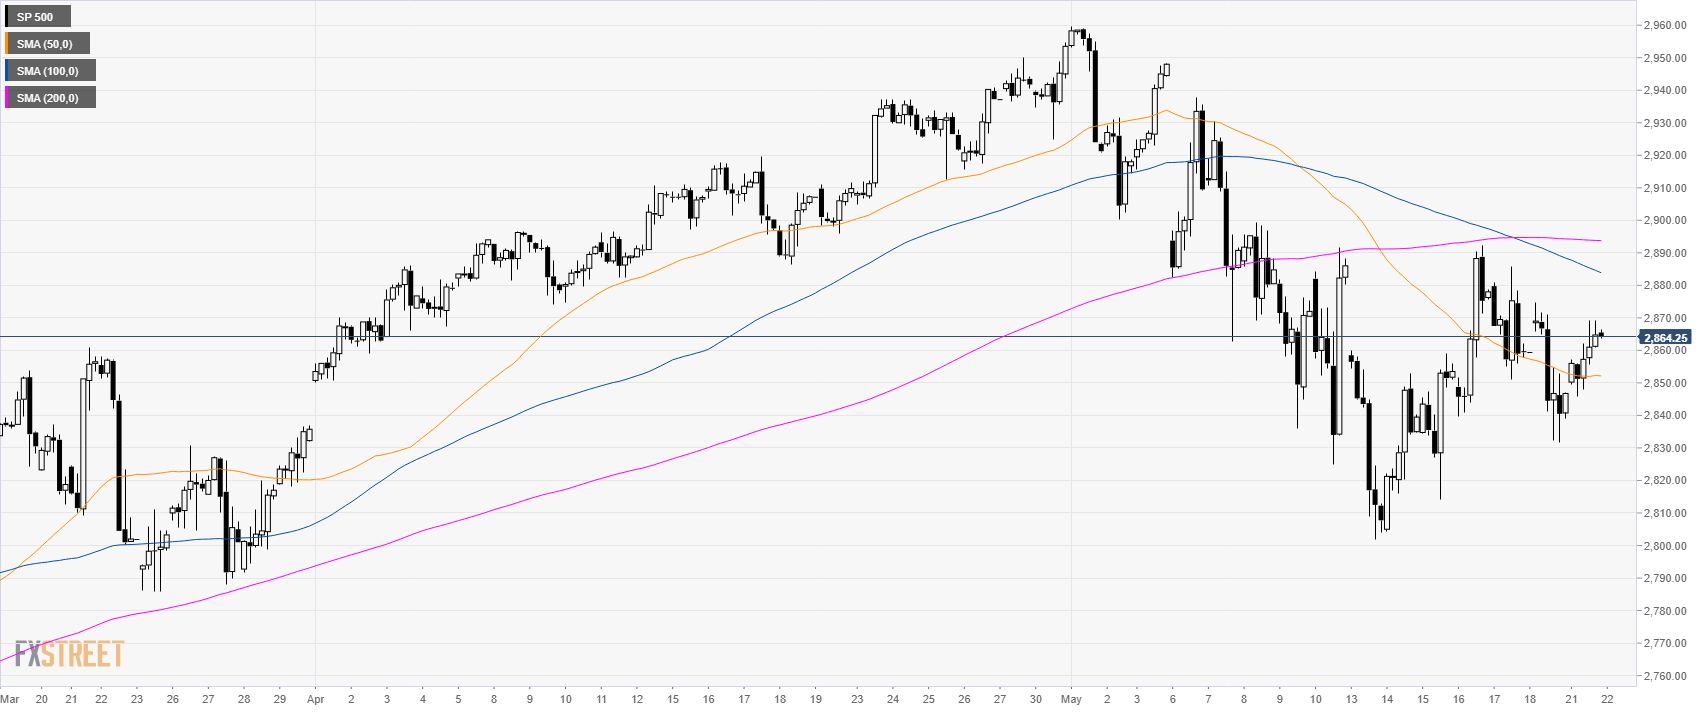
S&P500 4-hour chart
The market is consolidating above the 50 SMA.
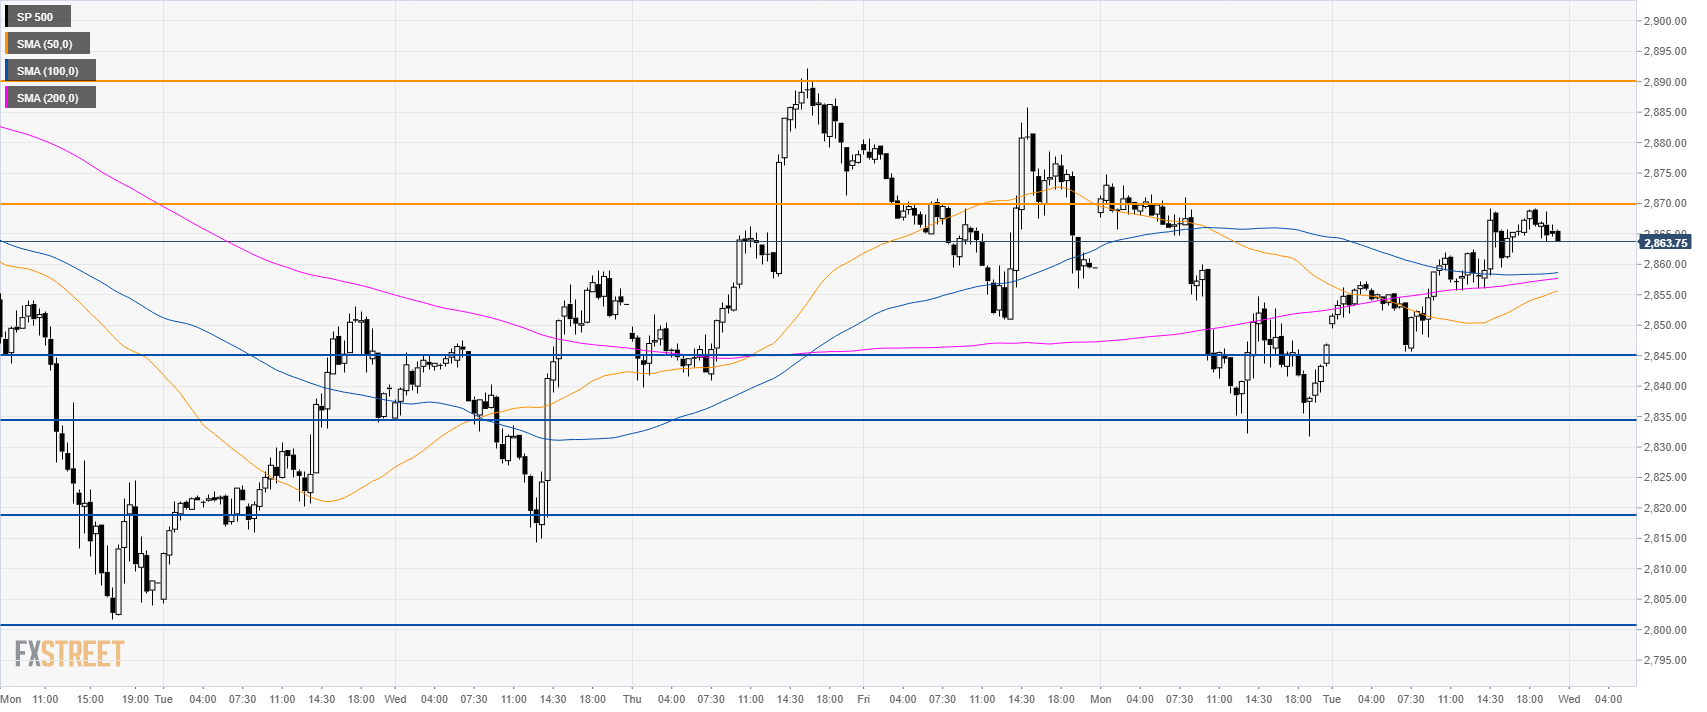
S&P500 30-minute chart
The level to beat for bulls is 2,870.00 resistance. If the market can break above it then 2,890.00 can be on the cards on Wednesday. On the flip side, if the buyers fail in their attempt, bears can step back in and drive the market towards 2,845.00 and potentially to 2,835.00 levels.
Additional key levels