10 May 2019
NZD/USD technical analysis: 6-week long resistance-line holds the gate to 0.6680
- A descending trend-line since March 26 continues to be a tough nut for bulls.
- The further downside can recall October 2018 bottom.
Following its recovery, NZD/USD is trading near 0.6600 ahead of the European session on Friday. However, the pair still trades beneath 0.6620 trend-line resistances that is being stretched since March 26.
Should prices rise beyond 0.6620 upside barrier, 38.2% Fibonacci retracement of its declines since March and multiple highs from April 23 at 0.6680 can gain buyers’ attention.
Also, the pair’s successful trading above 0.6680 enables it to target 0.6715 and 61.8% Fibonacci retracement close to 0.6780.
Alternatively, 0.6570 and 0.6525 can entertain sellers for the time being.
If at all bears rule trade sentiment under 0.6525, 0.6470 can offer an intermediate halt before October 2018 low around 0.6420 grab market attention.
NZD/USD 4-Hour chart
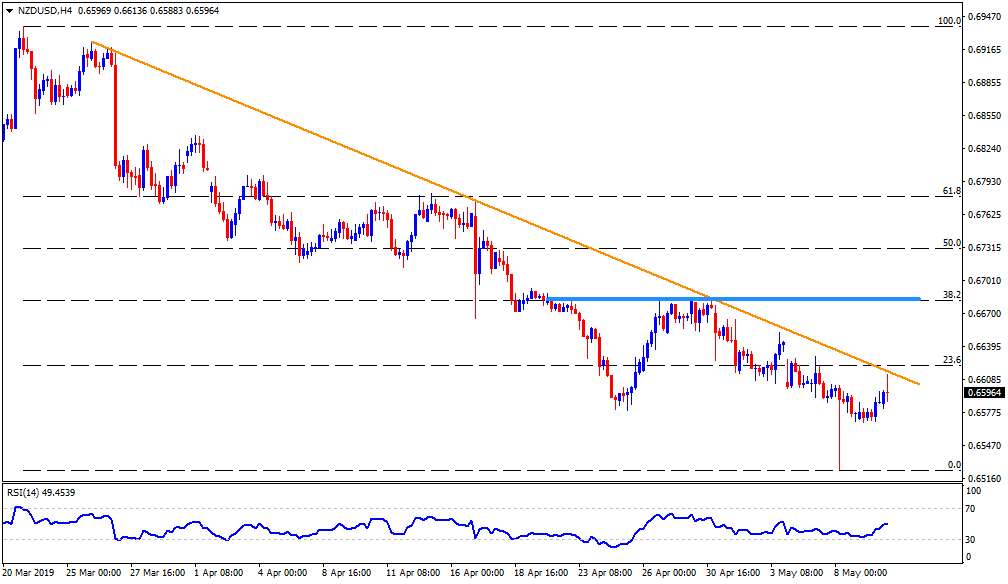
Trend: Bearish