3 May 2019
WTI technical analysis: $60.70/60 is the level to beat for bears
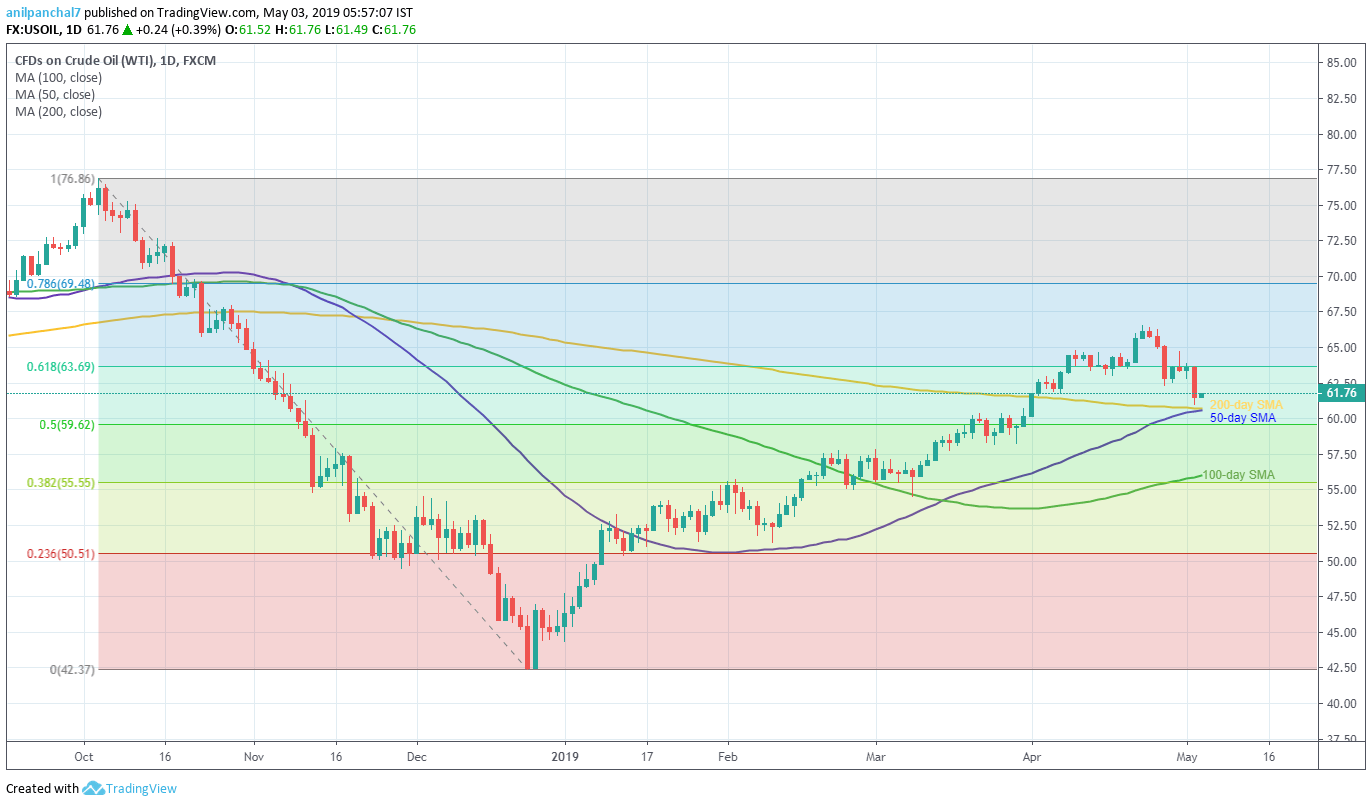
- 50-day and 200-day SMA confluence limit immediate downside.
- Buyers aim for 61.8% Fibonacci retracement after the recent pullback.
Following its failure to slip beneath 200-day SMA, WTI is on the bids around $61.75 during the early Asian session on Friday.
From the current levels, $62.50 seems immediate resistance for buyers to beak in order to aim for 61.8% Fibonacci retracement of its October – December downturn near $63.70.
Given the prices manage to remain strong beyond $63.70, $64.00, $64.70/80 and $65.60 are likely following resistances to watch.
Alternatively, $60.70/60 area comprising 50-day and 200-day simple moving average (SMA) can question sellers targeting $60.00 round-figure.
If bears dominate past-$60.00, 50% Fibonacci retracement near $59.65/60 and $58.00 could flash on their radar.
WTI daily chart
Trend: Pullback expected