22 Apr 2019
Gold Technical Analysis: Intraday positive move falters near 100-hour SMA
• The precious metal was seen trying to build on Friday's attempted bounce from a support marked by 50% Fibonacci retracement level of the $1196-$1347 recent up-move.
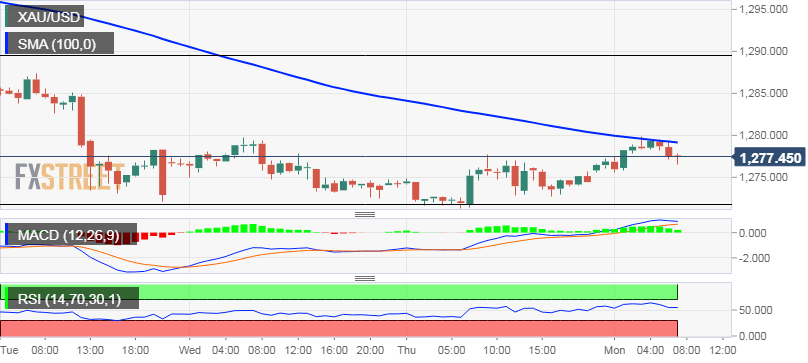
• Bulls, however, struggled to capitalize on the recovery move and the intraday positive move faltered near 100-hour SMA amid holiday-thinned trading conditions.
• Meanwhile, oscillators on the 1-hourly chart have just started gaining positive traction but maintained their bearish bias on 4-hourly/daily charts and warrant caution.
• Hence, it would be prudent to wait for a sustained move beyond the mentioned barrier before positioning for any further recovery towards $1285 horizontal resistance.
Gold 1-hourly chart