2 Apr 2019
Gold Technical Analysis: Pennant breakdown on 1H chart favors re-test of recent lows near $1,280
Gold is trading on the defensive at $1,287 and could drop to $1,281 (March low) in the next day or two, as the path of least resistance is to the downside, according to the pennant breakdown seen in the hourly chart.
Hourly chart
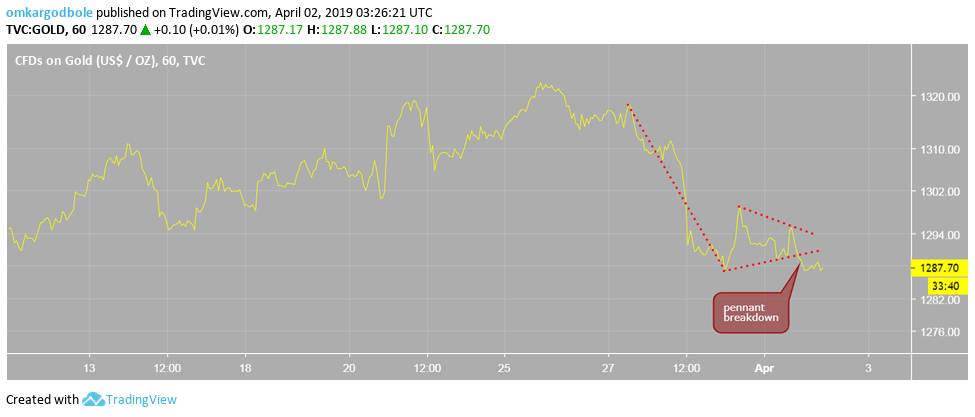
The pennant breakdown is a continuation pattern, which often ends up accelerating the preceding bearish move (slide from highs near $1,320 to $1,287).
Supporting that bearish case are the downward sloping 5- and 10-day moving averages (MAs) and the below-50 readings on the daily and hourly chart RSIs.
Trend: Bearish