25 Mar 2019
GBP/JPY Technical Analysis: 200-day SMA restricts immediate downside near 144.70
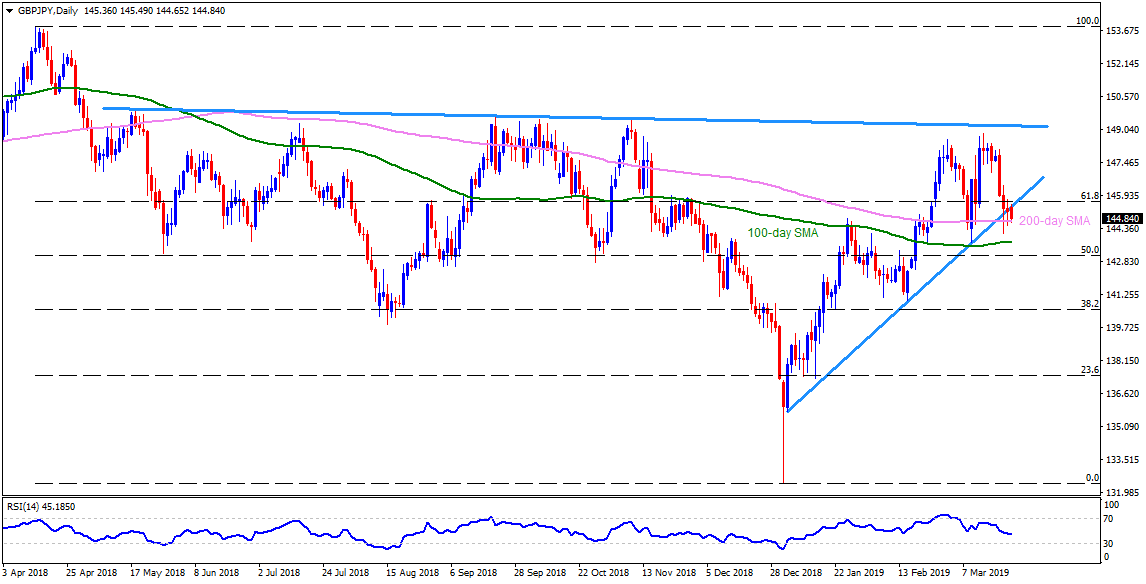
GBP/JPY daily chart
- In spite of breaking twelve-week-old ascending trend-line, the GBP/JPY pair is presently trading around 200-day SMA level of 144.70 during early Monday.
- The quote needs to slip under 144.70 simple moving average (SMA) support in order to aim for 100-day SMA level of 143.70 whereas 50% Fibonacci retracement of its April 2018 to January 2019 downturn can limit further declines at 143.10.
- Should prices keep trading southwards past-143.10, 141.80 and 141.10–141.00 can please sellers.
- Alternatively, an upside clearance beyond 145.40 support-turned-resistance may need to surpass 61.8% Fibonacci retracement to target 146.00 and 146.60.
- Additionally, 147.50 and the current month high near 148.90 may please buyers after 146.60 but ahead of challenging them with ten-month-old descending trend-line at 149.30.
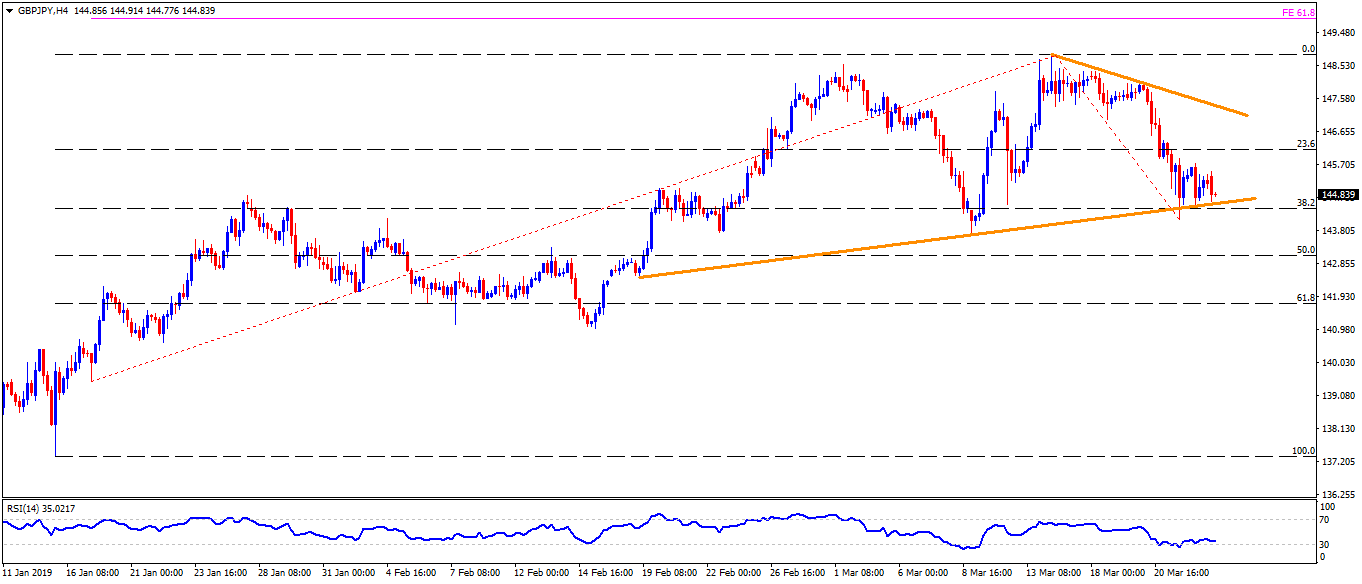
GBP/JPY 4-Hour chart
- Immediate ascending trend-line connecting lows since February 19, at 144.55, can validate the pair’s decline after 144.70.
- Also, 148.40 can offer an intermediate halt during the pair’s rise above 147.50.
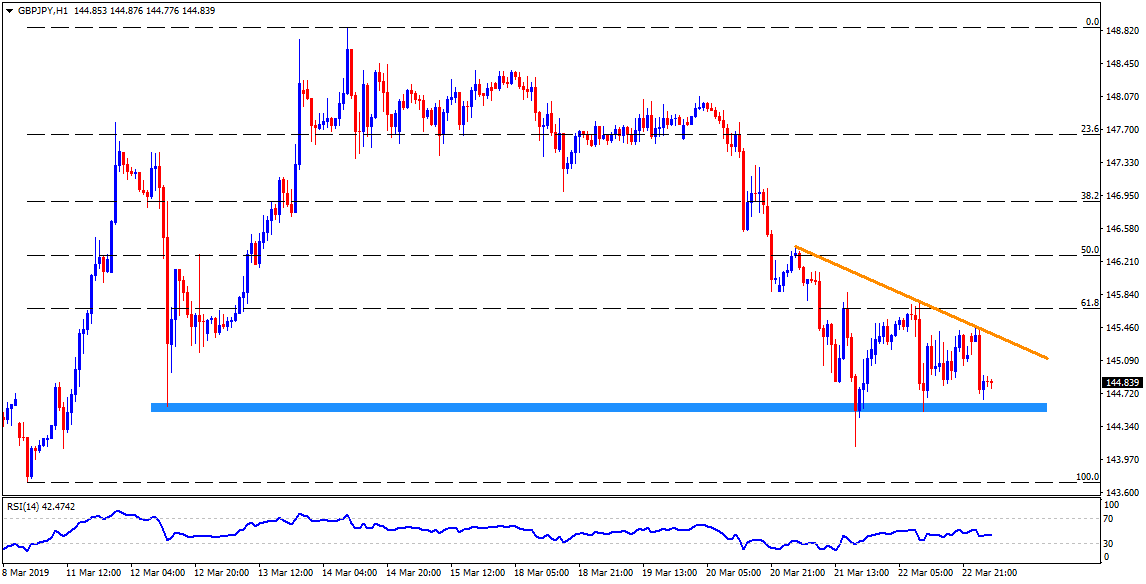
GBP/JPY hourly chart
- 144.60-50 and 144.00 seem nearby supports to watch ahead of expecting further downside.