6 Mar 2019
Gold/AUD Technical Analysis: Double bottom breakout on hourly
A weaker-than-expected Aussie Q4 GDP has pushed gold in AUD terms (XAU/AUD) above AUD 1,822.40, confirming a double bottom breakout on the hourly chart.
The pattern has opened the doors to AUD 1,834 (target as per the measured height method). Validating that breakout is RSI's move above 50.00 and rising MACD.
The bullish view would be invalidated if prices fall back below the neckline support (former resistance) of AUD 1,822.40.
Hourly Chart
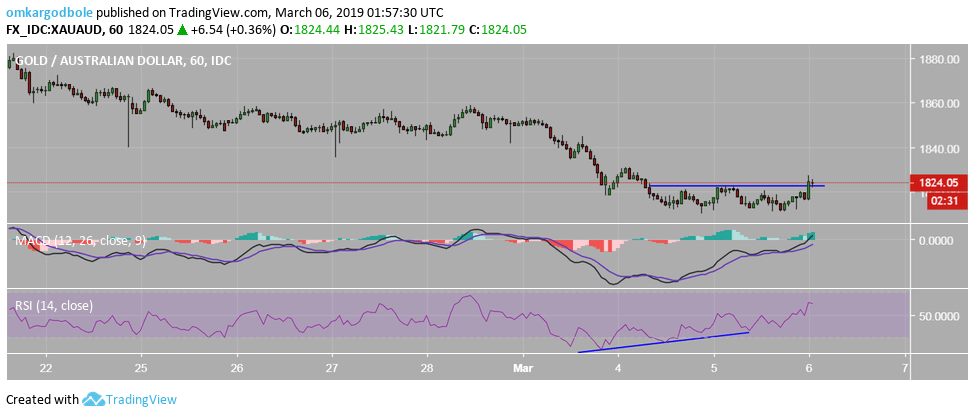
Trend: Bullish
Resistance: AUD 1,1831, AUD 1,834
Support: AUD 1,822, AUD 1,810