USD/CHF Technical Analysis: Greenback refreshes Tuesday’s highs near 1.0090 level against CHF
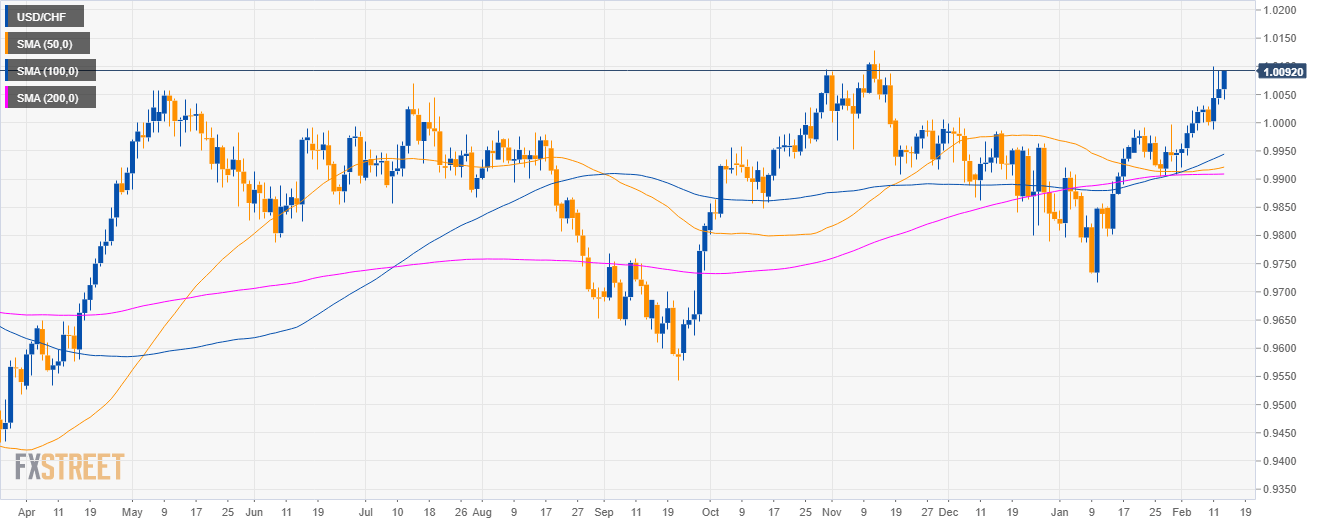
USD/CHF daily chart
- USD/CHF is trading in a sideways trend above the 50, 100 and 200-day simple moving averages (SMAs).
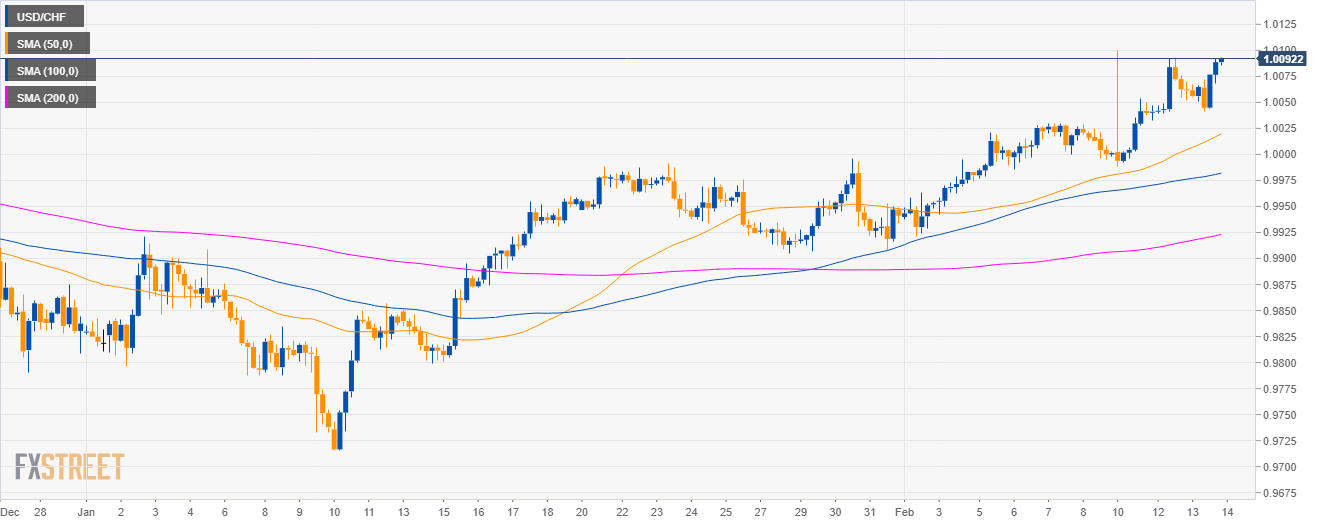
USD/CHF 4-hour chart
- USD/CHF is trading above its main SMAs suggesting bullish momentum in the medium-term.
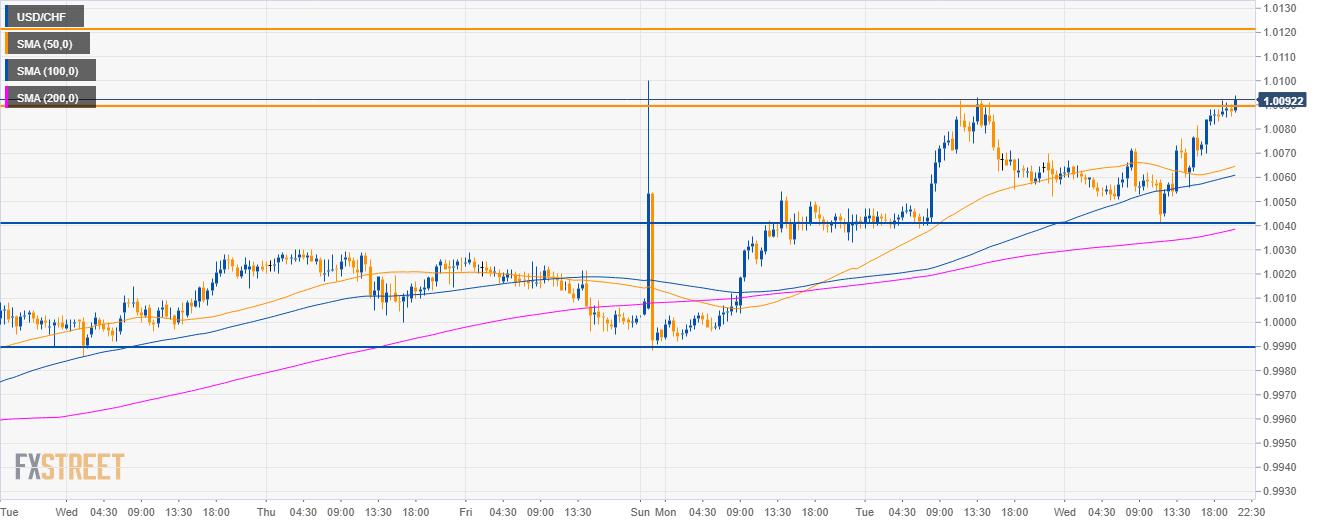
USD/CHF 30-minute chart
- USD/CHF is trading above its main SMAs suggesting bullish momentum as the bulls are attempting to break above Tuesday’s high.
- Bulls will try to continue the upmove and close above 1.0090 to reach 1.0120 and 1.0200 to the upside.
- On the way down, support is seen at 1.0040 and 0.9990 levels.
Additional key levels
USD/CHF
Overview:
Today Last Price: 1.0092
Today Daily change: 32 pips
Today Daily change %: 0.32%
Today Daily Open: 1.006
Trends:
Daily SMA20: 0.9971
Daily SMA50: 0.9919
Daily SMA100: 0.994
Daily SMA200: 0.9909
Levels:
Previous Daily High: 1.0093
Previous Daily Low: 1.0033
Previous Weekly High: 1.003
Previous Weekly Low: 0.9943
Previous Monthly High: 0.9996
Previous Monthly Low: 0.9716
Daily Fibonacci 38.2%: 1.007
Daily Fibonacci 61.8%: 1.0056
Daily Pivot Point S1: 1.0031
Daily Pivot Point S2: 1.0002
Daily Pivot Point S3: 0.9971
Daily Pivot Point R1: 1.0091
Daily Pivot Point R2: 1.0122
Daily Pivot Point R3: 1.0151