GBP/USD Technical Analysis: Cable bulls are relentless as they blast towards 1.3160 target
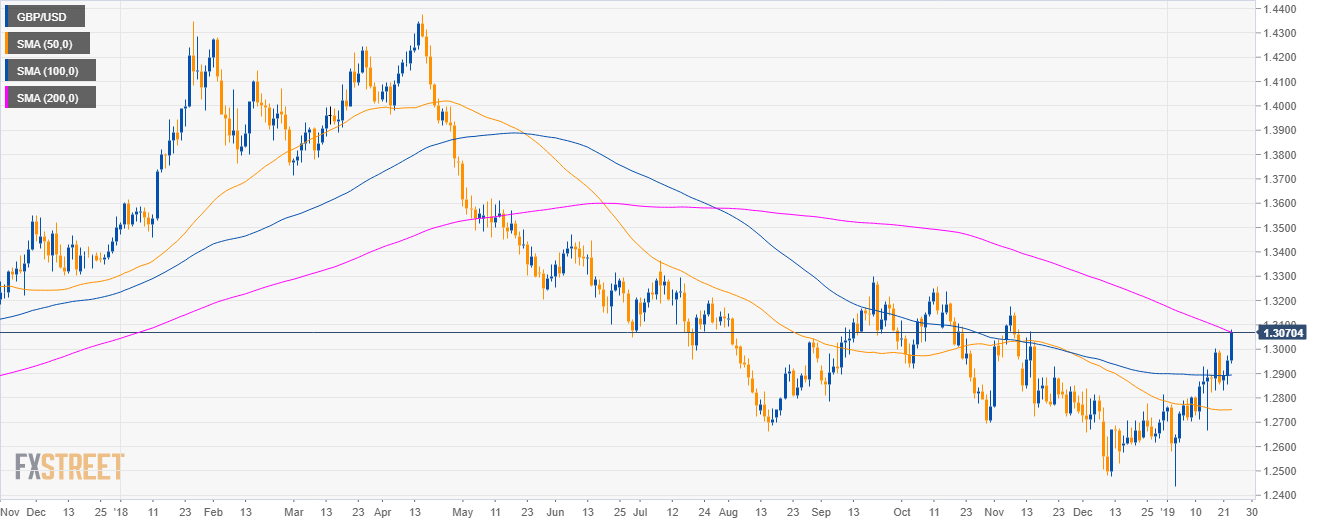
GBP/USD daily chart
- GBP/USD is evolving in a bear trend below its 200-day simple moving averages (SMA) on the daily chart.
- However, bulls have reclaimed the 50 and 100 SMAs and they are now testing the 200 SMA, all suggesting intense bullish activity.
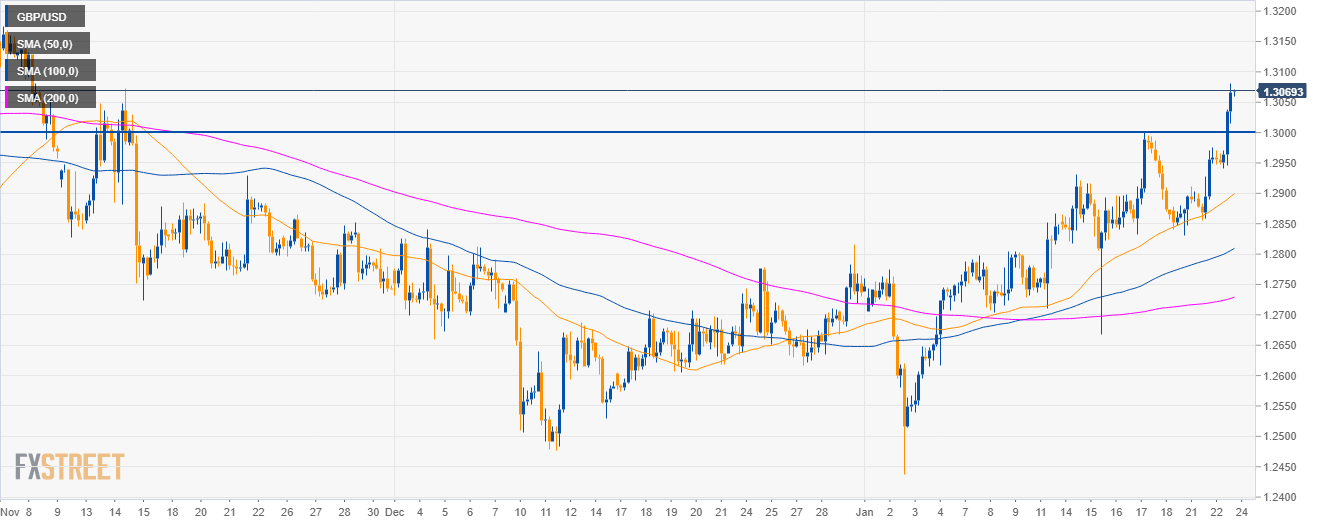
GBP/USD 4-hour chart
- GBP/USD is trading above the main SMAs and the 1.3000 round figure suggesting bullish momentum in the medium-term.
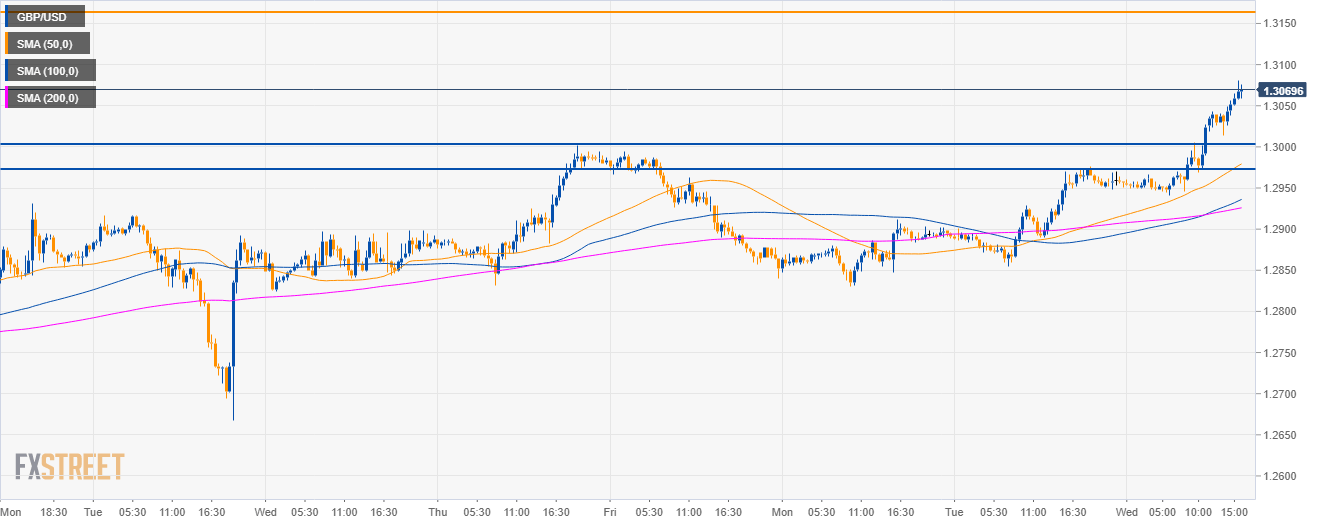
GBP/USD 30-minute chart
- GBP/USD is trading above its main SMAs suggesting bullish strength.
- Bulls show no signs of stopping their advance and the target to the upside can be seen at the 1.3160 level in the coming sessions.
- Support is seen at the 1.3000 figure and 1.2970 level.
Additional key levels
GBP/USD
Overview:
Today Last Price: 1.3069
Today Daily change: 117 pips
Today Daily change %: 0.90%
Today Daily Open: 1.2952
Trends:
Daily SMA20: 1.2785
Daily SMA50: 1.2751
Daily SMA100: 1.2892
Daily SMA200: 1.3079
Levels:
Previous Daily High: 1.2976
Previous Daily Low: 1.2855
Previous Weekly High: 1.3002
Previous Weekly Low: 1.2668
Previous Monthly High: 1.284
Previous Monthly Low: 1.2477
Daily Fibonacci 38.2%: 1.293
Daily Fibonacci 61.8%: 1.2901
Daily Pivot Point S1: 1.288
Daily Pivot Point S2: 1.2807
Daily Pivot Point S3: 1.2759
Daily Pivot Point R1: 1.3001
Daily Pivot Point R2: 1.3049
Daily Pivot Point R3: 1.3122