11 Oct 2018
USD/CAD Technical Analysis: Greenback might be overbought against CAD
- USD/CAD broke above the 200-period simple moving average on the 4-hour chart switching the main bias to bullish.
- However, USD/CAD is now stalling below 1.3083 (September 27 swing high) as the RSI and the Stochastic are in overbought condition, suggesting that failure to break above 1.3083 can lead to a pullback down towards 1.3000 figure.
- A breakout above 1.3083 would see the bull trend extending towards 1.3200 figure
USD/CAD 4-hour chart
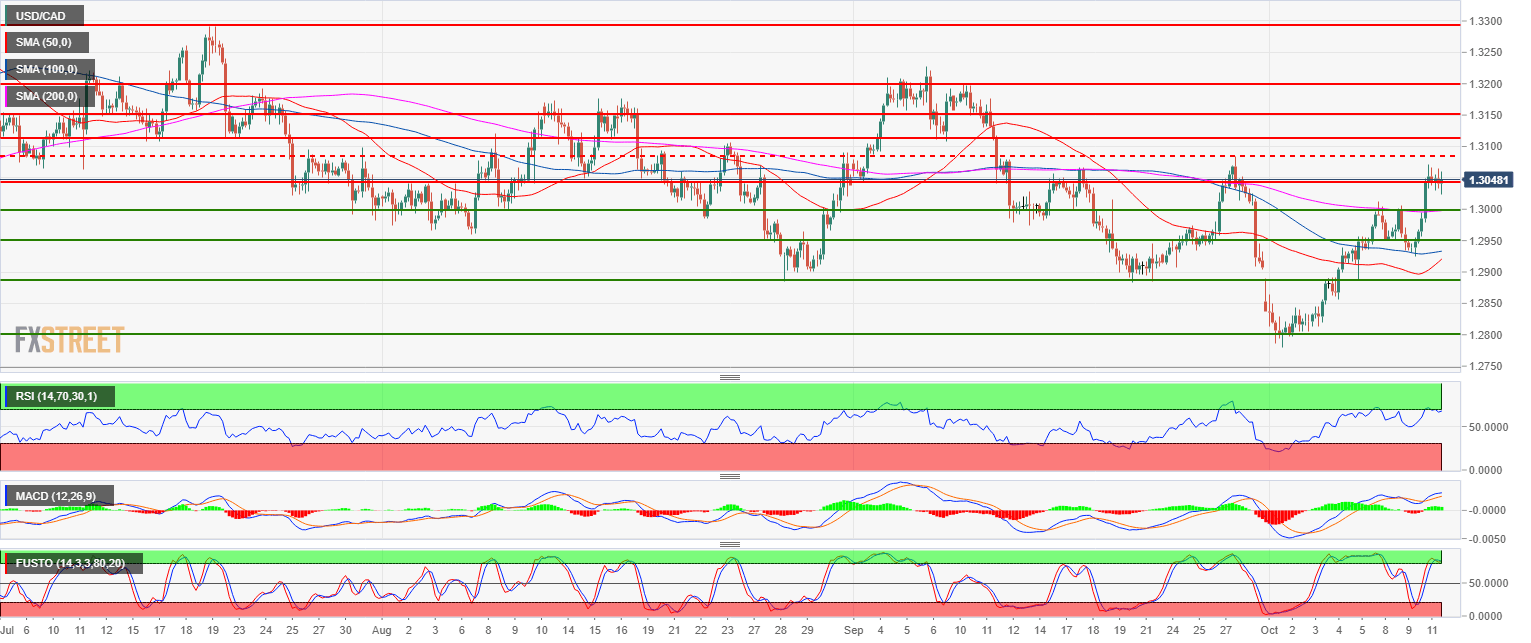
Spot rate: 1.3065
Relative change: 0%
High: 1.3068
Low: 1.3024
Main trend: Bullish
Resistance 1: 1.3083 September 27 swing high
Resistance 2: 1.3108, September 7 low
Resistance 3: 1.3200 figure
Support 1: 1.3048 August 14 low
Support 2: 1.3000 figure
Support 3: 1.2950-59 multi-month key level and August 7 low
Support 4: 1.2882-1.2900 September 20 low and figure
Support 5: 1.2855-65 June 6 low - 200-day SMA
Support 6: 1.2800 figure
Support 7: 1.2727 May 11 low