21 Sep 2018
NZD/USD Technical Analysis: on pace to clear into 0.67
- The NZD/USD is enjoying a decent run-up against the US Dollar, with broader markets throwing the gears into full risk-on mode. With the Kiwi staging a full recovery this week and quickly running out of room to run before hitting the resistance wall from August's consolidation zones near the 0.6700 technical level, buyers should be cautious about entering from here, and opting to wait for a decent pullback that successfully holds over the last bottom at the 0.6500 level, and mark in a higher low.
- Data has been thin lately for the Kiwi, but next week will be seeing the Reserve Bank of New Zealand (RBNZ) return with fresh statements, and bulls could be on the receiving end of some fairly bullish comments from the New Zealand central bank after the recent NZ GDP reading came in well above expectations.
- On the immediate technical side, the Kiwi is currently challenging the 50-day EMA, and a clear break from here will leave the path to 0.6700 open.
NZD/USD Chart, 1-Hour
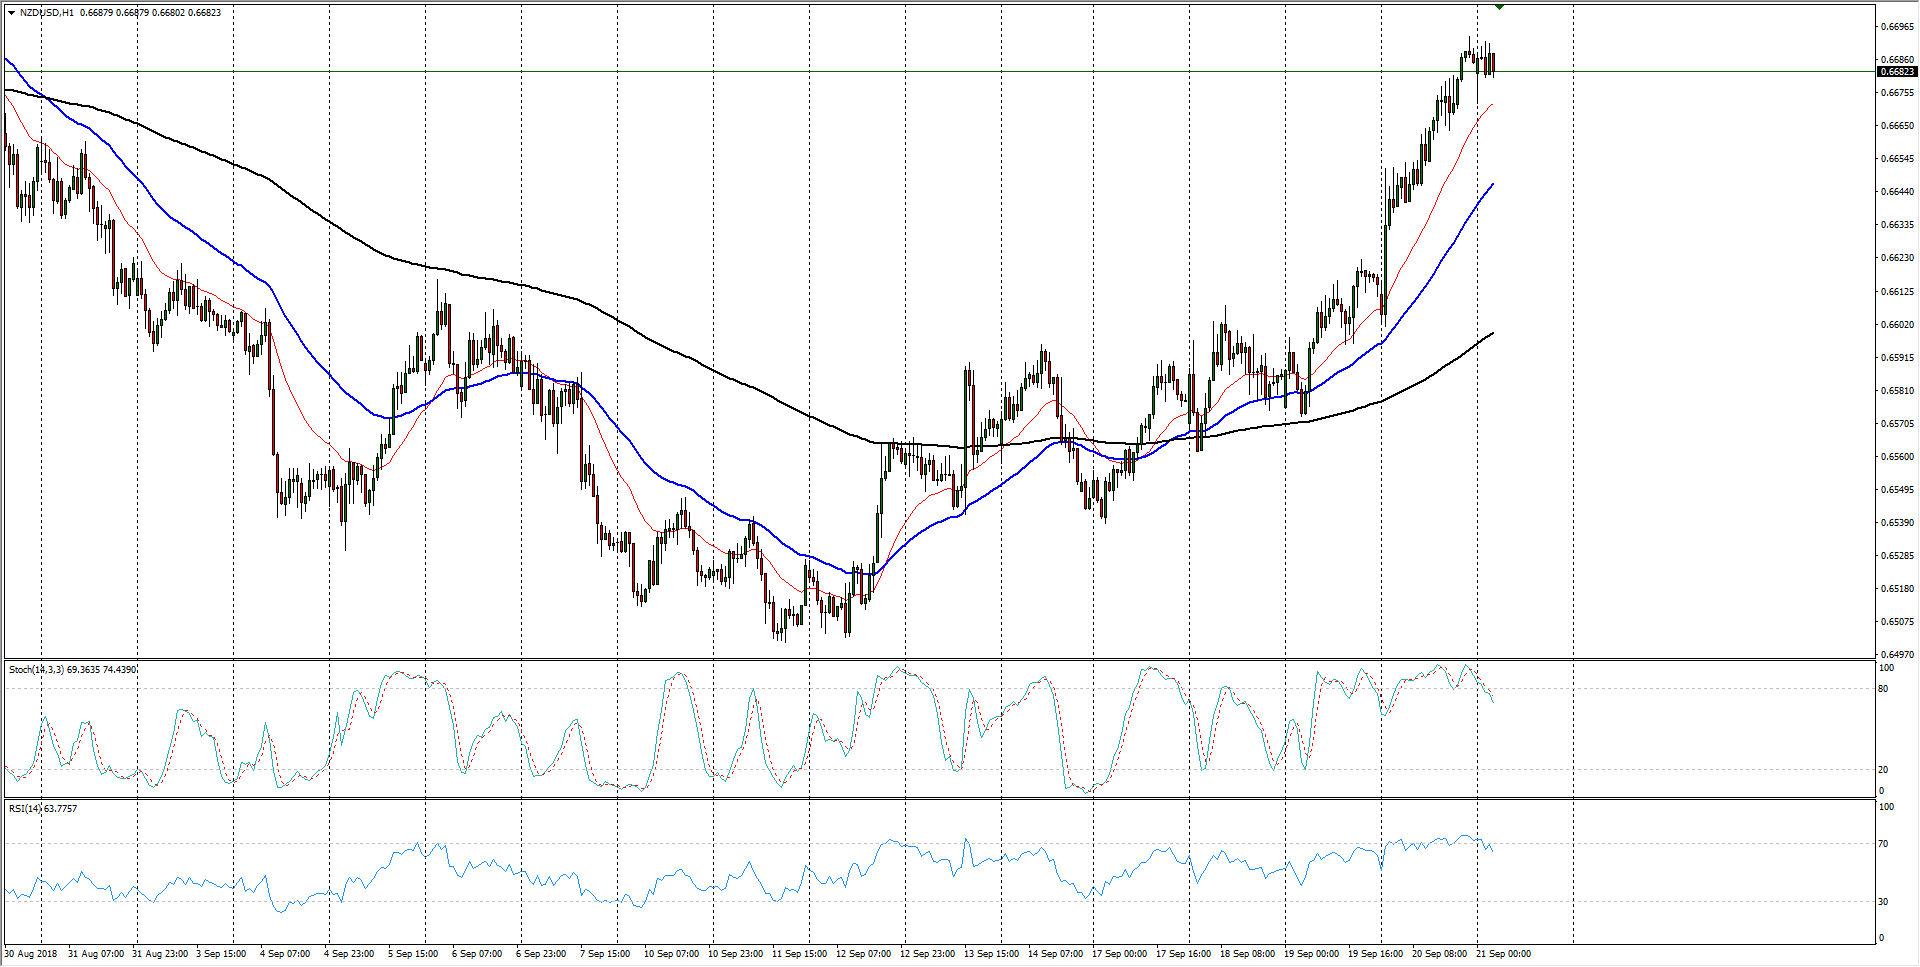
| Spot rate | 0.6682 |
| Relative change(current week) | +2.06% |
| High | 0.6691 |
| Low | 0.6672 |
| Trend | Bullish |
| Support 1 | 0.6646 (50-hour EMA) |
| Support 2 | 0.6599 (200-hour EMA) |
| Support 3 | 0.6538 (current week low) |
| Resistance 1 | 0.6727 (late August swing high) |
| Resistance 2 | 0.6859 (July top) |
| Resistance 3 | 0.6907 (200-day EMA) |