20 Sep 2018
USD/JPY Technical Analysis: USD/JPY bulls testing the 112.50 resistance level
- USD/JPY bulls are extending the bull trend by testing the 112.50 resistance.
- USD/JPY is trading above its 50, 100 and 200-period simple moving averages (SMA) which are rising and widening suggesting a bullish bias. The market is also trading above the bull trendline which is considered bullish.
- If bulls are able to keep the market above 112.50 the next objective is 113.18, 2018 high.
USD/JPY 4-hour chart
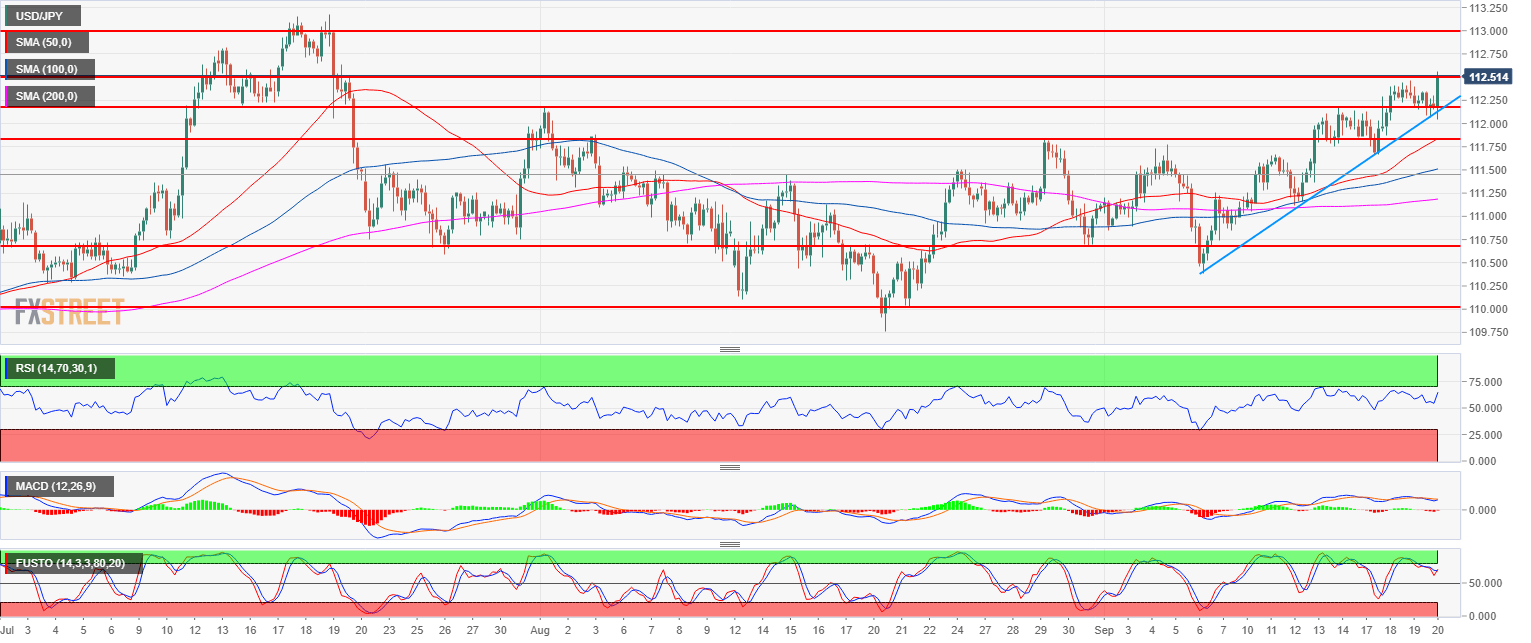
Spot rate: 112.50
Relative change: 0.22%
High: 112.54
Low: 112.04
Main trend: Bullish
Resistance 1: 112.50 figure
Resistance 2: 113.18, 2018 high
Resistance 3: 114.00 figure
Support 1: 112.00-112.17 zone, figure and August 1, swing high
Support 2: 111.84 August 29 swing high
Support 3: 111.84 August 29 swing high
Support 4: 111.54 August 6, high
Support 5: 111.45 August 8 high
Support 6: 111.00 figure
Support 7: 110.75, July 23 swing low
Support 8: 110.00 figure
Support 9: 109.37 June 25 low