Gold Technical Analysis: Ascending trend-channel breakout suggests an extension of intraday up-move
• The precious metal benefitted from a broad-based USD weakness and is now looking to build on its intraday bullish break through an ascending trend-channel formation on the 15-min. chart.
• Technical indicators on hourly/daily charts have failed to support any firm directional bias, albeit a move beyond the channel resistance has opened the room for additional intraday gains.
• A sustained move beyond the key $1200 psychological mark will further add credence to the constructive outlook and continue driving the metal higher amid escalating US-China trade tensions.
Gold 15-min. chart
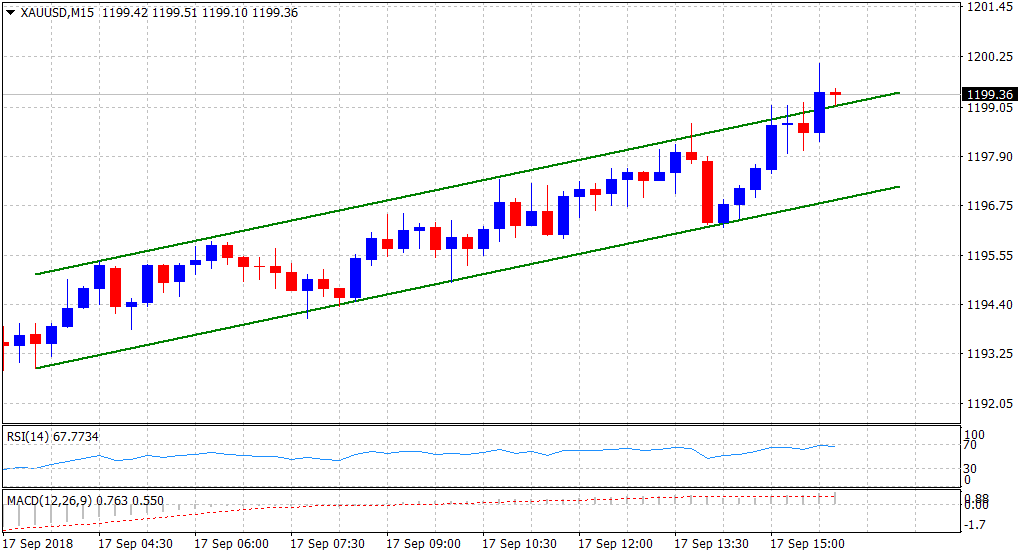
Spot Rate: $1199.36
Daily Low: $1192.84
Trend: Intraday bullish
Resistance
R1: $1201.34 (50-day SMA)
R2: $1208.58 (Friday's swing high)
R3: $1213 (horizontal zone)
Support
S1: $1198.37 (200-period SMA H1)
S2: $1192.84 (current day swing low)
S3: $1187.75 (2-1/2 week lows set last Tuesday)