NZD/USD Technical Analysis: a modest recovery attempt stalls near 50-hour SMA
• The pair snapped two-consecutive days of losing streak and staged a modest rebound from 2-1/2 week lows, albeit pauses near 50-period SMA on 1-hourly charts.
• Short-term technical indicators are yet to show any signs of a possible bullish reversal and hence, the current leg of up-move could be solely attributed to short-covering.
• A slide back towards challenging the 0.6900 handle remains a distinct possibility in case of even the slightest pickup in the US Dollar demand.
NZD/USD 1-hourly chart
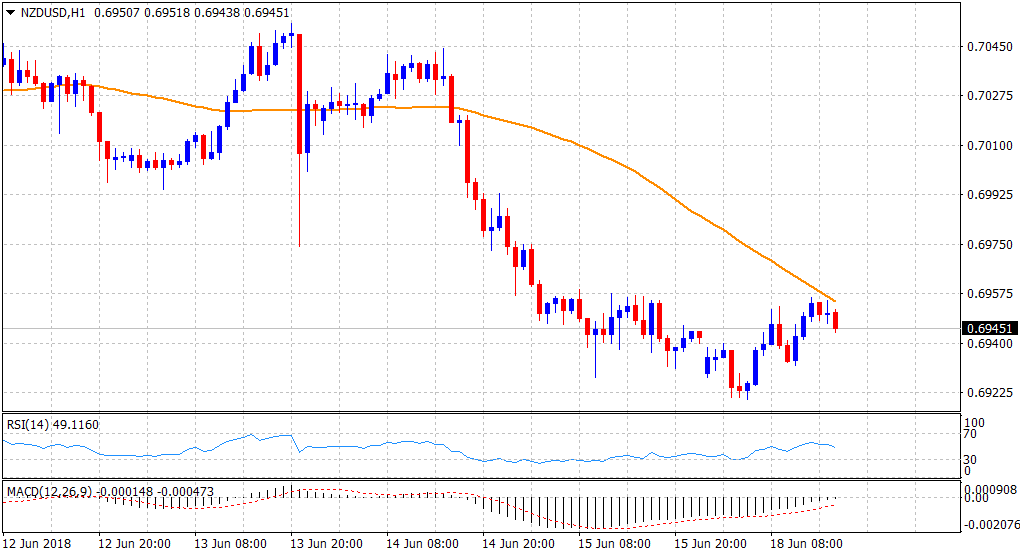
Spot Rate: 0.6945
Daily High: 0.6956
Daily Low: 0.6920
Trend: Bearish
Resistance
R1: 0.6957 (50-period SMA H1)
R2: 0.6974 (R1 daily pivot-point)
R3: 0.7000 (psychological round figure mark)
Support
S1: 0.6920 (current day low)
S2: 0.6901 (S2 daily pivot-point)
S3: 0.6883 (May 30 swing low)