Gold vs. US dollar; Challenging 200-DMA vs. Neutral near 100
Currently, the Gold spot is trading at 1257.25, down -0.05% or (63)-pips on the day, having posted a daily high at 1263.90 and low at 1253.39. On the other hand, the US 10yr treasury yields have traded from 2.36% to 2.31%, up +2.31% on the day, as of writing an impressive comeback at 2.36% or +0.0533.
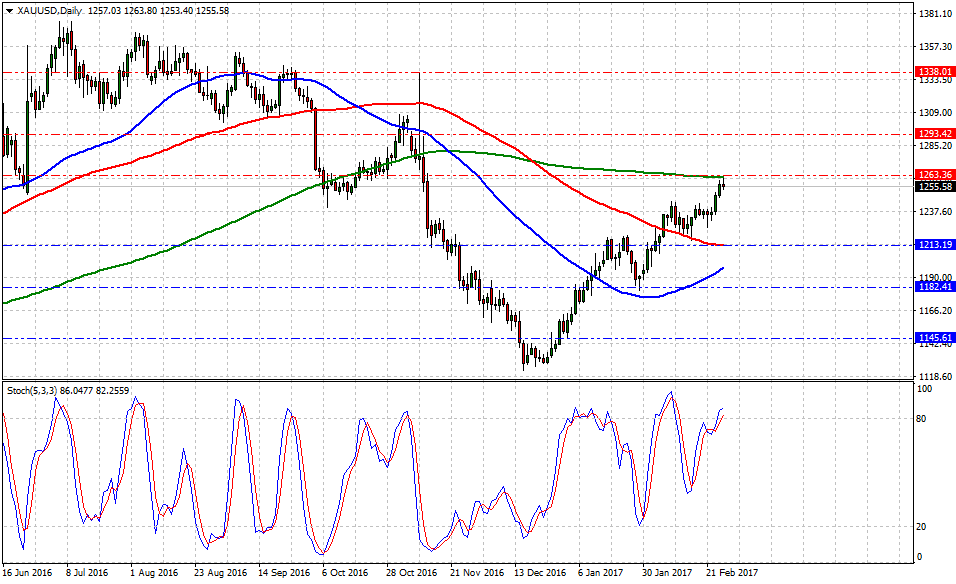
The shiny metal seems to be exhausted after a robust recovery from the 2016 lows near $1122 adding $123 in gains. However, there is evidence to expect a short profit-taking as prices trade closer to the 200-DMA.
On the other hand, if Trump's stimulus package were to be in the position to impact markets before the end of 2017, then Gold prices could retrace to retest the 100-DMA near $1210 as other asset classes become more attractive to investors starving for higher yields.
The Fed is the only thing that might upstage Trump
Historical data available for traders and investors indicates during the last 9-weeks that Gold spot had the best trading day at +1.41% (Jan.5) or 1664-pips, and the worst at -1.11% (Jan.18) or (1331)-pips.
Technical levels to watch
In terms of technical levels, upside barriers are aligned at $1263 (200-DMA), then at 1290 (high Nov.10) and above that at $1330 (high Nov.9). While supports are aligned at $1213 (100-DMA), later at $1190 (50-DMA) and below that at $1140 (low Jan.3).
On the other hand, Stochastic Oscillator (5,3,3) seems to slightly change direction inside the overbought territory to head south. Therefore, there is evidence to expect Gold losses in the near term.
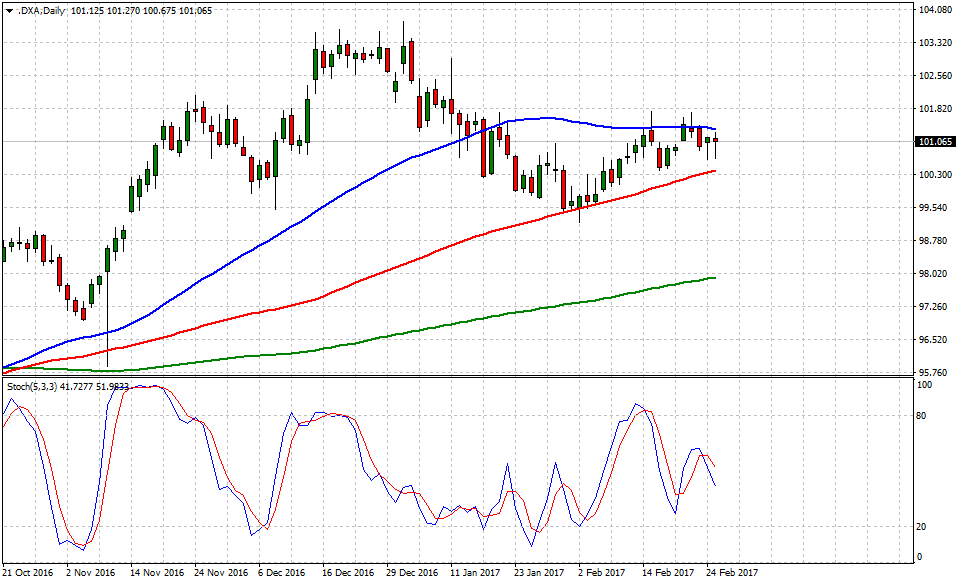
The greenback – gauged by the US Dollar Index seems muted 'at 50-DMA gates' which contributed to a sell-off across the board (this represents the 5th attempt during the last 9 trading sessions). However, the bullish tone hasn't been diluted as long as the buck holds 100.20 handle. Now, there is technical evidence to expect either a break above 101.60 or sell-off towards the 100-DMA near 100.20.
In term of technical levels, upside barriers are aligned at 101.40 (high Feb.23), then at 102.10 (high Jan.16) and above that at 102.40 (high Jan.9). Meanwhile, supports are aligned at 100.20 (100-DMA), later at 99.60 (low Feb.6) and finally below that at 98.54 (low No.11). On the other hand, once again, today's daily candlestick seems to emulate a 'bullish pin bar' could translate in one more attempt to challenge its 50-DMA; short-term bottom?
AUD/USD analysis: consolidating, but downward potential increasing