Silver Price Analysis: XAG/USD rebounds from one-month low, upside potential seems limited
- Silver attracts some buying on Thursday and snaps a three-day losing streak to a one-month low.
- The technical setup still seems tilted in favour of bears and supports prospects for further losses.
- A move beyond the $23.20-$23.30 confluence support breakpoint might negate the bearish bias.
Silver gains some positive traction on Thursday and for now, seems to have snapped a three-day losing streak to over a one-month low, around the $22.60 region touched the previous day. The white metal sticks to the recovery gains through the early part of the European session and currently trades around the $22.80 area, up over 0.60% for the day, though the technical setup remains tilted in favour of bearish traders.
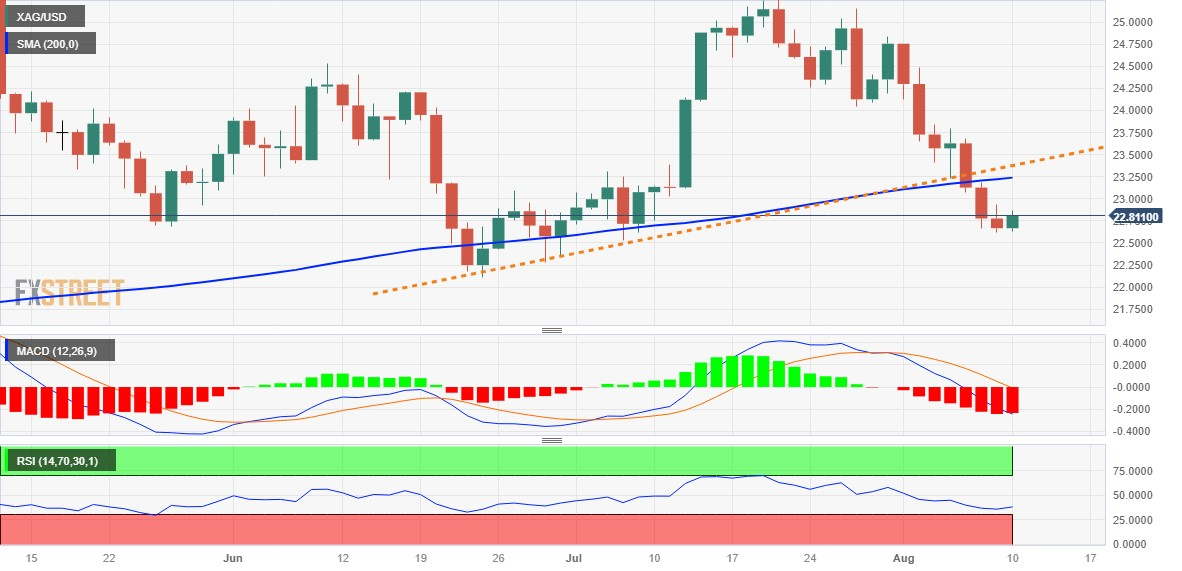
This week's sustained breakdown below the $23.30-$23.20 confluence – comprising the very important 200-day Simple Moving Average (SMA) and a short-term ascending trend-line – adds credence to the negative outlook for the XAG/USD. Moreover, oscillators on the daily chart are holdign deep in the negative territory and are still far from being in the oversold zone. This, in turn, suggests that the path of least resistance for Silver is to the downside and supports prospects for an extension of the recent .downward trajectory witnessed over the past three weeks or so.
Hence, a subsequent slide back towards retesting the multi-month low, around the $22.15-$22.10 area touched in June, looks like a distinct possibility. Some follow-through selling below the $22.00 round-figure mark will be seen as a fresh trigger for bearish traders and drag the XAG/USD to the $21.55-$21.50 intermediate support en route to the $21.00 mark. The downward trajectory could get extended further towards the $21.00 level before Silver eventually aim to challenge the YTD low, or levels just below the $20.00 psychological mark touched in March.
On the flip side, any further recovery beyond the $23.00 round figure is likely to attract fresh sellers and remain capped near the $23.20-$23.30 confluence support breakpoint, now turned resistance. The latter should act as a pivotal point, which if cleared decisively might trigger a short-covering move. The XAG/USD might then climb further towards the $23.60-$23.65 horizontal barrier before aiming to reclaim the $24.00 mark.
Silver daily chart
Technical levels to watch