Gold Price Forecast: XAU/USD remains inside the woods below $2,020.00 as investors await US Retail Sales
- Gold price is awaiting the US Retail Sales data release and the outcome of US debt ceiling talks for further guidance.
- The USD Index corrected gradually to near 102.43 amid accelerating odds of a pause in the rate-hike spell by the Fed.
- The downward-sloping trendline plotted from all-time highs at $2,079.78 is acting as a barricade for the Gold bulls.
Gold price (XAU/USD) remained choppy on Monday as investors shifted to the sidelines for the release of the United States Retail Sales data. The precious metal traded in a narrow range of $2,012-2,022 as investors believe that the outcome of US debt ceiling talks and the release of the US Retail Sales data will be an important trigger for further guidance.
S&P500 ended with decent gains on Tuesday as investors perceive that the Federal Reserve (Fed) will pause its aggressive interest rate hike policy. The street is anticipating that further monetary policy restrictions would make severe damage to the economy.
The US Dollar Index (DXY) corrected gradually to near 102.43 amid accelerating odds of a pause in the rate-hike spell by Fed chair Jerome Powell. US inflation has significantly slowed down and labor market conditions have also softened, which is providing luxury to the Fed for keeping the monetary policy stable. Contrary, the 10-year US Treasury yields jumped above 3.50%.
Going forward, monthly Retail Sales (April) data is seen expanding by 0.7% vs. a contraction of 0.6%. This indicates a rebound in the households’ retail demand, which could propel inflationary pressures again.
Gold technical analysis
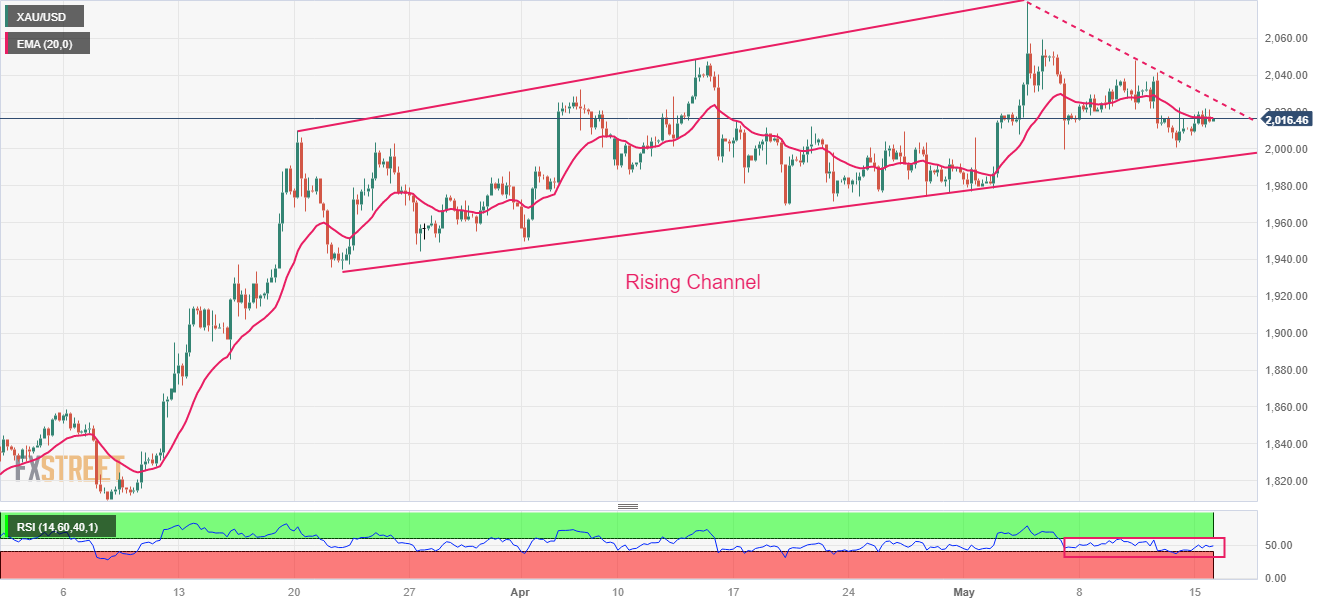
Gold price is auctioning in a Rising Channel chart pattern on a four-hour scale. The upper portion of the aforementioned chart pattern is plotted from March 20 high at $2,009.88 while the lower portion is placed from March 22 low at $1,934.34. The downward-sloping trendline plotted from all-time highs at May 03 high at $2,079.78 is acting as a barricade for the Gold bulls.
The 20-period Exponential Moving Average (EMA) at $2,016.50 is overlapping the Gold price, indicating a lackluster move ahead.
The Relative Strength Index (RSI) (14) is oscillating in the 40.00-60.00, which indicates that investors await a fresh trigger for further action.
Gold four-hour chart